It’s Beginning to Look A Lot Like…1971
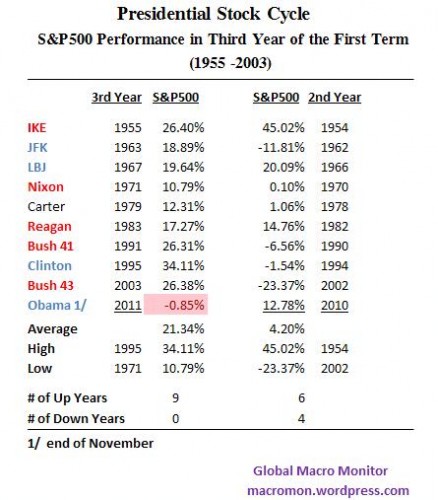
The Global Macro Monitor posted several pieces earlier in the year about the Presidential Stock Cycle. See here, here, and here. The third year of a first term President is the strongest year in the cycle. The table illustrates that if the S&P500 doesn’t close at 1257.64 (closed today at 1246.96) or higher, President Obama will be the first post-war “Investor in Chief” to have a S&P500 down year in the third year of his first term.
It’s also beginning to feel a lot like 1971. We had thought earlier in the year the market would trade more like 1991, also a year of macro swans, including a major credit crunch and the first gulf war. After trading up early that year, the market moved in a relatively tight range and ramped hard at the end of the year, 10.5 percent in last 14 trading days. We thought the volatility band would expand this year, but not as much as it did.
The S&P500 now appears to be tracking the 1971 analog, also the third year of a first term President. Ironically, 1971 was also a year of similar currency turmoil as President Nixon officially ended the gold standard and the Breton Woods international monetary system in the middle of August.
During a massive run on gold, then Treasury Secretary John Connally and Under Secretary for Monetary Affairs Paul Volcker advised the President to let the dollar float, effectively making it a fiat currency. This caused panic in the global markets until other countries let their currencies go.
History is rhyming here with our own Euro crisis and sovereign debt crisis.
Let’s also hope Santa brings us a similar December ramp in the S&P500 as he did in 1971 and 1991. Stay tuned.


It’s amazing how these theories change every day (it starting to look like 1971, 1991, 1929, etc…) So far, 2011 did not look like anything else, and neither did 1991 or 1971. Why do we always try to convince ourselves that the S&P has a pattern or must follow a pattern?