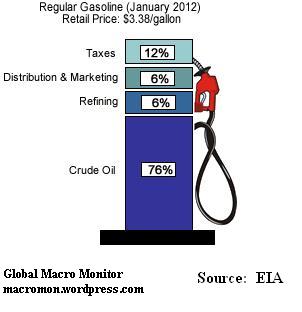
Chart of the Day: Don’t Blame the Gas Station for Price Spike
Here’s a cool graphic from the EIA on what drives the price of a gallon of gasoline in January 2012. We paid $4.20 last night in California!
Note 76 percent of the price for a gallon of gas is driven by crude oil. Only 6 percent by refining and 6% distribution and marketing. Though these components do vary over time, but not by much.
So when you start to crack at paying $100 to fill your tank, remember it’s really not the crack spreadBlame the crude or Brent!
(click here if graphic is not observable)

Compare with the tax take in the UK..
https://www.bbc.co.uk/news/business-15462923
Useless graph – does not inform as to what market forces influence the various components.