Wall Street vs. Main Street: Recessions and Depressions
This is a post from John Lounsbury which will cover ground on the official designation of recessions and his own designation of depressions about which he has written in the past. Previous articles in this series have discussed:
- The NBER process for dating recessions;
- Redefining the business cycle;
- Normalization of GDP to population; and
- Normalization of employment to population.
The previous discussion of GDP might be called the “Wall Street business cycle”. The discussion of employment could be called The “Main Street business cycle”.
Of course, there are more factors involved in the business cycle than just GDP and employment. These two have been selected because they are “broad brush” representations of economic activity.
A recent article by Ben, at the Department of Numbers, suggested that recessions should be timed separately for GDP and employment. That is the direction my work has been pointing.
NBER Recessions
The NBER (National Bureau of Economic Research) defines the start and end dates of economic recessions, both after the fact. Some dates are determined as much as a year after the event actually occurs, such as the December 2008 announcement that a recession had started in December 2007. The dates of recessions all the way back to 1854 are listed here.
The NBER does not measure depressions.
Wall Street Recessions and Depressions
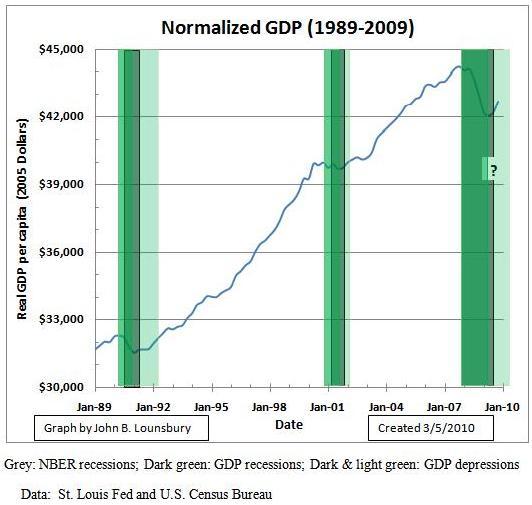
The following three graphs show the NBER recessions (in gray) and the GDP recessions and depressions (in green) for the three 21 year intervals between 1947 and 2009.
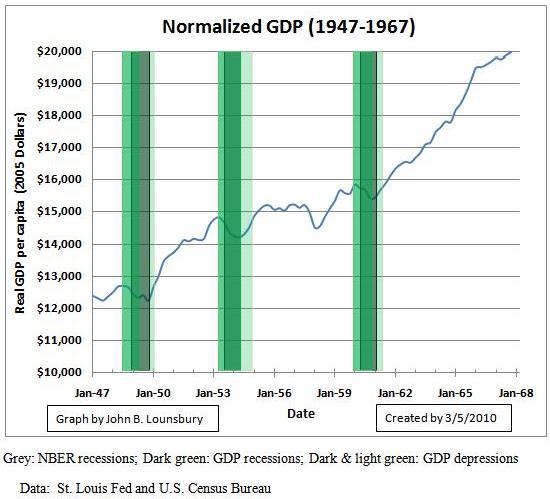
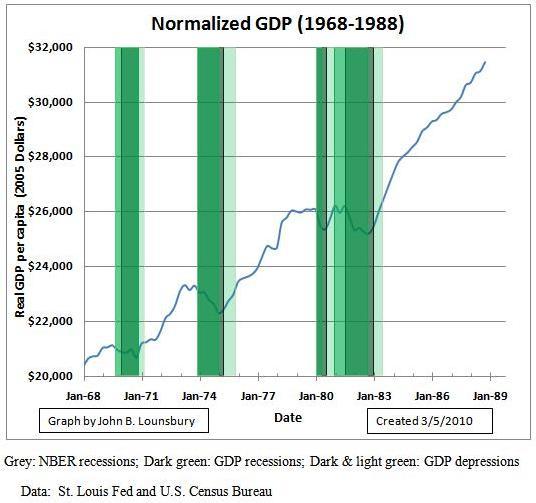
Eight of the ten recessions are single recessions within a defined depression. The recessions of 1980 and 1981-82 are both within the same depression. However, this is just barely so. The recovery of normalized GDP to the level of 1Q/1980 occurred in 1Q/1981; the same quarter was the point from which the next normalized GDP decline began.
It could be argued that one depression ended and another began at the same time. I reject that interpretation as illogical: It is nonsense to say that one depression ends at the same time another begins. They are a single double dip depression.
Main Street Recessions and Depressions
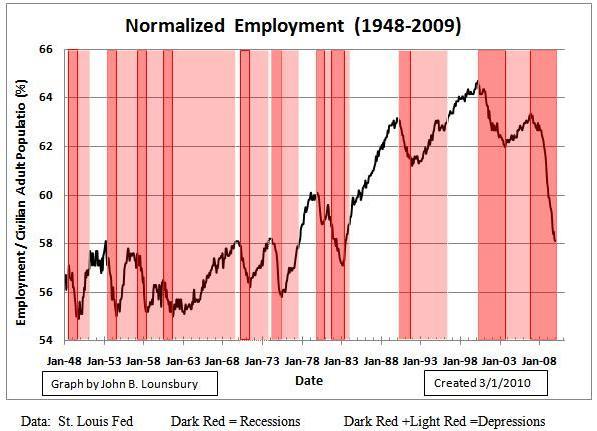
We will use the normalized employment data in the preceding article to represent recessions and depressions on Main Street. In the section after this one, the recessions and depressions on Wall Street (represented by normalized GDP) will be compared to the Main Street business cycle.
The following graph shows the employment recessions and depressions over the past 60 years. There were seven depressions and eleven recessions. Four depressions (1948-51, 1969-73, 1974-79 and 1990-96) each contained one recession. Two depressions (1979-83 and 2000-?) each contain two recessions. The depression of 1953-69 contained three recessions.
Of course, the current depression has not concluded, so additional recessions are possible before it ends.
The growth in normalized employment (normalized to adult civilian population) from the mid 1960s to 2000 can be attributed to shrinkage of the military population (the smaller contributor) and the increasing participation of women in the labor force. There was a small counter factor due to the gradual increase in the percentage of retirees over the 35 years. Now the initial wave of baby boomers is reaching normal retirement age and the rate of people entering retirement would normally be expected to increase.
However, there are survey reports that the number of people in their 60s that are delaying retirement for economic reasons is increasing. A recent analysis suggests that the number of people working past normal retirement age has been increasing for at least a decade and the trend may continue. See here.
To make the above curve more meaningful, the normalized employment ratio should be adjusted for demographics going forward. The perfectly corrected curve would most likely show depressions in employment between periods of full employment, possibly in the range 64% of the adjusted adult population.
The question of how to properly adjust the normalized employment curve for demographics is being put off to a future time. For now, we will just recognize that factor is introducing a bias (downward with advancing time) that may or may not become more significant in the coming decades.
Comparing Wall Street and Main Street Business Cycles
The following graphic shows the NBER recessions, the normalized GDP recessions and the normalized employment recessions superimposed on the same timeline.

The first eight recessions show similar durations for all three measurements of recession, with the exception of (1) the recession in 1980 which had a longer employment recession than either NBER or GDP metrics and (2) the recession of 1981-82 which had a longer GDP recession than either NBER or employment metrics.
The three most recent recessions had much longer duration employment recessions than either NBER of GDP metrics.
The following graph shows GDP and employment depressions on the same timeline. The NBER does not determine dates for depressions.

Employment depressions last longer or much longer than GDP depressions. One employment depression, 1953-1969 covers the time span of two separate GDP depressions. The current employment depression is the other on this timeline that covers more than one GDP depression.
Summary
Using employment as a metric for recessions and depressions on Main Street and either the NBER or GDP as indicators of recessions and depressions on Wall Street, we can draw the following conclusions:
- It should be no surprise that the business cycles experienced by Wall Street and Main Street are correlated in time.
- The duration of the recessions on Wall Street and Main Street were quite similar from 1947 through 1982.
- The durations of recessions starting in 1990 have been significantly longer on Main Street than on Wall Street.
- Depressions on Main Street have been far longer than those on Wall Street. Since 1947, 34% of the time has been spent in GDP depressions while 78% of the time has been spent in employment depressions.
- I have a fundamental question: Why is the longest Main Street depression (1953-69) associated with a time generally considered to be one of growing prosperity. In fact, within this time frame, we had the longest time period (1962-69) without a Wall Street depression? This question deserves more research.
There has been no attempt to adjust the adult civilian population for the increasing percentage of people in retirement which is likely to have occurred over the 62 years of this study. That has introduced an unknown negative bias to the determination of employment recessions and depressions. Further refinement of this analysis should lead to a reduction of the duration of the employment timelines, especially for depressions. This affect will be analyzed in further work.
Other work to be completed includes:
- Measurement of the relative economic impact of different recessions and depressions. My proposed term for these impacts is “burden”, introduced here.
- Comparison of the business cycles of the first half of the twentieth century with those covered here.
- Application of this analysis to other business cycle variables including industrial production, aggregate personal income less transfer payments, stock market returns, etc.
—————————————-
John Lounsbury provides comprehensive financial planning and investment advisory services to a small number of families on a fee only basis. He has a background which includes 34 years with a major international corporation, 25 years in R&D management and corporate staff positions. Since 2002 he has operated his own sole proprietorship business. John is also one of the top ten authors at Seeking Alpha and a featured commentator at TheStreet.com Real Money.
Comments are closed.