Jobless claims remain dangerously elevated
The US Department of Labor released the latest jobless claims report this morning and the numbers were poor. From their email, announcing the figures:
In the week ending September 19, the advance figure for seasonally adjusted initial claims was 870,000, an increase of 4,000 from the previous week’s revised level. The previous week’s level was revised up by 6,000 from 860,000 to 866,000. The 4-week moving average was 878,250, a decrease of 35,250 from the previous week’s revised average. The previous week’s average was revised up by 1,500 from 912,000 to 913,500.
So, initial jobless claims are at a level higher than peaks in other cycles. And we’ve been stalled at this level for weeks now.
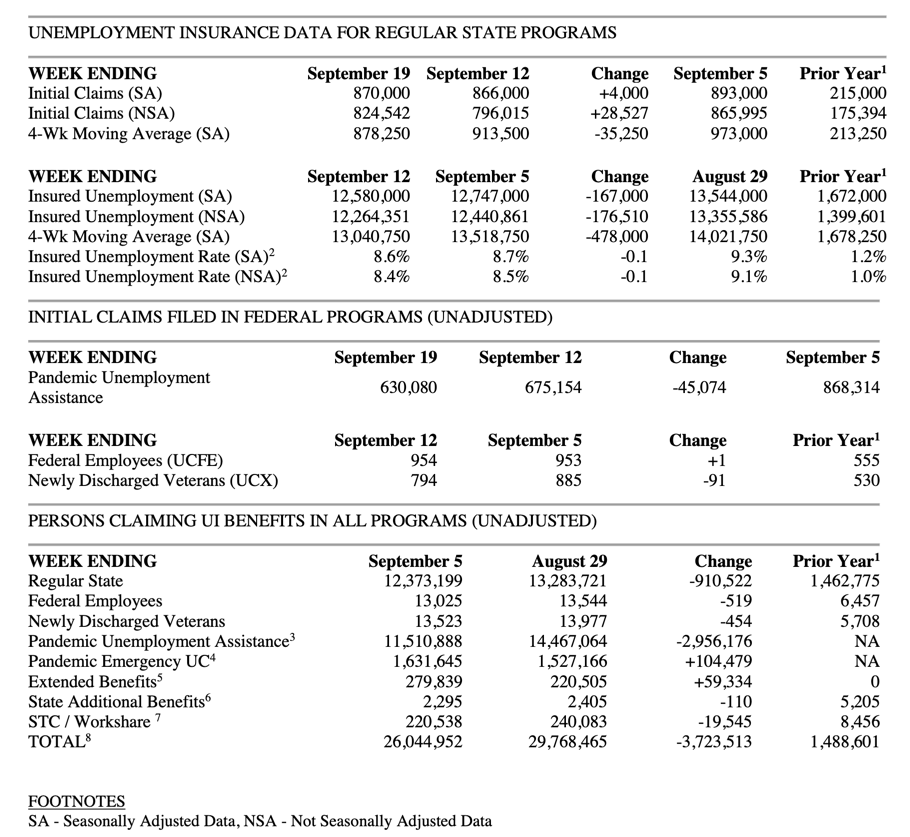
For me, the standout number in this report was the huge fall in the number of people getting pandemic unemployment assistance – down from an estimated 14.5 million last week to 11.5 million this week. That’s a shockingly high fall. And I have not determined what accounts for it yet.
Last week, I told you about “the US Department of Labor’s tally for the number of persons claiming unemployment insurance benefits in all programs. I said it was a raw number, not seasonally-adjusted, and that it was incredibly high at nearly 30 million. I also wrote this:
The problem is that it might not be accurate. Here’s a Twitter thread on that topic from TJ Hedin of California Policy Lab, including a write-up on their site. The New York Times’ Ben Casselman has been on this as well.
The long and short is that we can’t really trust the data as much as we normally would. The scale of the crisis and the inability of US data collection systems to deal with it has made the resulting data sets less reliable. So, my focus has been mostly on directionality. What I want to see is what are the data telling us about where things are headed.
I am going to stick with that approach. The drop in PUA numbers only reinforces the sense I have that the scale, suddenness and uniqueness of the unemployment crisis makes data collection hard. So, I want to focus on directionality rather than point to specific levels.
Having said that, let me point out another ‘level’ oddity. Notice that the seasonally-adjusted insured unemployment rate in this report is 8.6%. That is higher than the last U-3 headline unemployment rate of 8.4%. And the numbers in the prior two weeks were also higher at 8.7% and 9.3%.
How is it possible that 8.6% of people are receiving unemployment insurance and the headline rate of unemployment is 8.4%? That makes no sense. Last year that insured unemployment rate number was ~1%, well below the U-3 headline unemployment rate – as it should be since not everyone who is unemployed is eligible to receive standard unemployment benefits. And remember that this rate does not include those receiving Pandemic Unemployment Assistance. It’s just a measure calculating the percentage of people getting standard jobless benefits in the US.
Clearly, U-3 is now understating unemployment. And with a flow of almost 900,000 people filing initial unemployment insurance claims per week, I expect the headline and U-6 unemployment rates to rise.
Comments are closed.