Hope reigns supreme despite the poor economic outlook
I took a hiatus from writing for a few days to see if I could get a clearer perspective. But, the reality is that there is no visibility to anything going forward. Making longer-term predictions is probably a fool’s errand then. Nevertheless, I do want to look at some of the data and see if we can draw some near-term conclusions.
Before I do, I have one housekeeping issue to alert you to. The Credit Writedowns Newsletter can now be found at www.creditwritedowns.com instead of www.creditwritedowns.com, The www.creditwritedowns.com URL is now back serving the ‘blog’, which I am using as the full archive for the over 10,000 posts on the site. If you have any problems, contact me at [email protected] or the admin at [email protected].
The depression
Let me start with this chart from Calculated Risk.
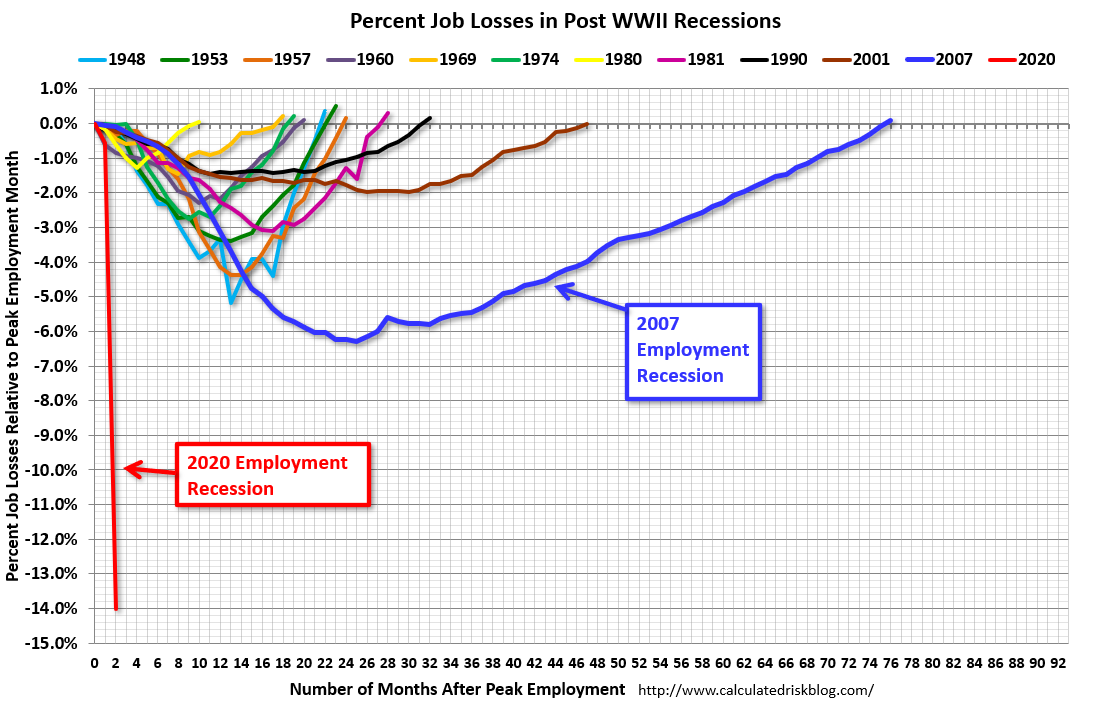
Bill McBride, who runs the Calculated Risk blog, has been producing this chart for at least a decade now. And what it shows is the loss of employment relative to recession employment peaks for each post World War 2 recession in the United States as well as the time it took to regain that peak.
Here’s what I’m seeing. Every recession before the dotcom bust was similar in nature. Some were deeper than others in terms of absolute job losses and some were longer than others in terms of the slowness of recovery. But, they were roughly similar in terms of orders of magnitude.
The dotcom bust changed that. The time it took to recover the previous employment peak, nearly four years, was a year and a half longer than the previous record jobless recovery in the early 1990s.
The recession following the 2007 Great Financial Crisis was even worse – much worse. I would say it was an order of magnitude longer in duration than all previous employment busts in the US.
But then look at the Covid-19 job loss. It’s off the charts bad. It’s just a straight line down compared to the other recessions on this chart.
So, here’s the question you have to ask yourself: how likely is it that these job losses are made up quickly? Put another way, how likely are we to see a V-shaped or a U-shaped recovery that has the US economy back to square one in 2 1/2 years? That’s how long the original jobless recovery took. Is that what we’re likely to see here? Or is the off-the-charts loss over two months likely to lead to a longer-term depression in employment?
What consumers and investors think
I think you know my answer is that this is going to be at least a depression with a small ‘d’ – if not something worse. But, a lot of people are still hoping for some other outcome. For example, 78% of workers say their layoff is temporary. According to recent polls, “[t]he more than 18 million workers who described themselves as on temporary layoff expect to return to work within six months.”
Let’s assume they’re right. That still leaves another 2 1/2 million people unemployed today, unemployed in six months. And that doesn’t even include people likely to lose their job in the interim. That could be millions more people. So, even in the most optimistic scenarios, we’re looking at 4 or 5 million people who are unemployed for more than six months. How long would it take to get these people employment again or to make up the lost income in the economy?
A U-shaped outcome gets you maybe 250,000 jobs per month or 16-20 months. But, a more reasonable assumption given the slowness of job recovery in the last three US recessions is something like 100 or 150,000 jobs per month in the beginning, followed by 200,000 later.
That’s more like 36-48 months at best, similar to the dotcom bust. This is the best case of best cases because it assumes a best case for job loss and for job re-gain.
When you look at markets, it’s the same optimism you see about the economy. According to this morning’s newsletter by Dion Rabouin of Axios:
- A Harris Poll survey of ordinary Americans released today found nearly a quarter (23%) have put more money into the stock market, compared to 19% who have taken money out and 45% who made no changes.
That’s 68% of people supporting markets at current levels or going higher. Hope springs eternal. Will these investors be proved right though? That’s likely only if the optimistic U-shaped economic recovery outcome comes to pass.
The Belgian example
Let’s look at this from another angle now. I want to use Belgium as the stalking horse here. That’s a country that has seen a high rate of coronavirus infections and deaths and is now coming out of a lockdown. Here’s how they’re talking about the economy (my translation from Dutch):
It is Monday morning, just after ten. In the budget chain Primark on the Meir in Antwerp, a woman puts a T-shirt in her shopping cart, which is already packed. Today, after eight weeks of lockdown, retailers are allowed to reopen their doors. After hoarding toilet paper and baker’s dough, does a rush to buy clothes now follow? “I have a six-month-old son who really needs new clothes,” she says. “He has grown out of everything, and ordering online costs me more.” She doesn’t go to other stores. Soon, it will be “straight home”.
The headline: ‘Retail will not survive a second lockdown’. In Belgium, 9 percent of self-employed people believe bankruptcy of their business is (very) likely. Since there are 825,000 self-employed, that’s over 70,000 of them at risk of losing their jobs. Belgian companies are already planning another 180,000 cuts. Put that together and you have 250,000 job losses.
If you add a second lockdown to that situation, retail most definitely won’t survive. My takeaway, then, is that the second wave would have to be an absolute disaster to force a second lockdown in any major western democracy. So we’ll have to live with the consequences of that.
My take
Here’s how I would characterize the situation then:
- The economic re-opening is likely permanent. Lockdowns are over for the long haul. And we are all moving toward a Swedish outcome.
- There will be a rebound from that. Pent-up demand is there, as with the Belgian mother buying clothes at Primark shows.
- But shopping habits have changed. People are still fearful – and will be fearful for some time – as the coronavirus continues to threaten our lives. That means the bounce will not get you to 100%
- Meanwhile, certain sectors of the economy will still be in relative lockdown: tourism, travel, events. These sectors will be devastated for month and years to come.
- At the same time, we have a whole cadre of people to re-employ, meaning the post-lockdown economy will take a triple hit from lost demand for those employed but fearful, locked down sectors, and from a loss of income for those unemployed.
That’s not a U-shaped outcome awaiting us. Government deficits will fill in the gaps via transfer payments. But that money will not be enough to get us back to square one anytime soon.
Going forward, the real threat, then, is a debt deflation. This is where the status quo I outlined above causes more companies to hit the wall and more people to lose their jobs and income sources. In a debt deflation, this loss of income and output has knock-on effects to other firms and people, causing them to hit the wall. And the situation snowballs.
We are not in living through a garden-variety recession here. The loss of output, irrespective of lockdowns is much greater. Therefore, downside risks are also much greater. And, with certainty, there will be policy errors.
That’s about as far as I am willing to go in predicting anything.
Comments are closed.