Some insights into (declining) US economic health
In the US stock market, technology stocks are leading the rally from the deeply oversold levels in December. And that has a lot of people thinking the worst is over. But this is just a relief rally. The real economy is actually decelerating. And this will almost certainly hit earnings. The only question now is how far that deceleration goes. Some thoughts on this below
Germany and employment are bad
The Fed is on hold, having rescinded its guidance for rate increases in 2019. And as I outlined yesterday, this owes to the real economy, not asset markets. Fed chair Jerome Powell has made clear that he is worried about economic activity outside of the US impacting the US economy. That’s because, abroad, the numbers are painful. Germany is the most important example. This morning, German factory orders came in showing a month-on-month decline of 1.6% for December. And the yield curve reacted, with Germany now negative out to 9 years.
But with the US government shut down, there has been a hole in US economic data. We can look at some of the residual US data and private data to fill in the gaps though. For example, on the jobs front, things still look bright, with the last number coming in at +304,000 for January, after a revised +222,000 for December.
The fact that the unemployment rate is rising can be seen two ways though. On the one hand, it is a sign of tightening slack in the labor force drawing people in hidden unemployment back into the labor force and counting them as unemployed. That’s a good thing. On the other hand, if you look at turns in business cycles, it has end of cycle dynamics written all over it.
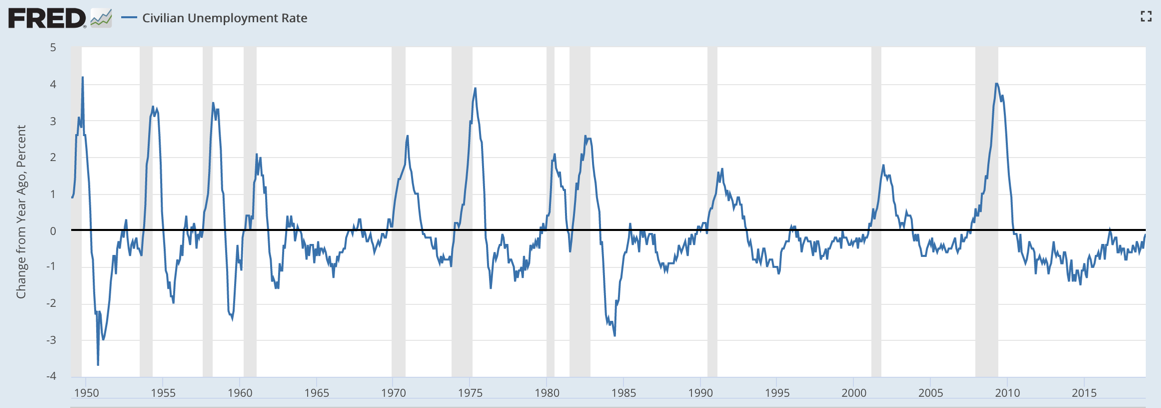
Source: St. Louis Fed
In fact, in previous recessions, the change in the unemployment rate over a year’s period hit the zero mark right about the time recession began, which is where we are at this point in the cycle. This is true in every cycle from 1948. The delta for January 2019 vs. January 2018 was only -0.1%. That’s a very bad thing.
I tend to look at rate of change data more than absolute levels. So this is a red flag to me.
ISM data are good, but the detail is worrying
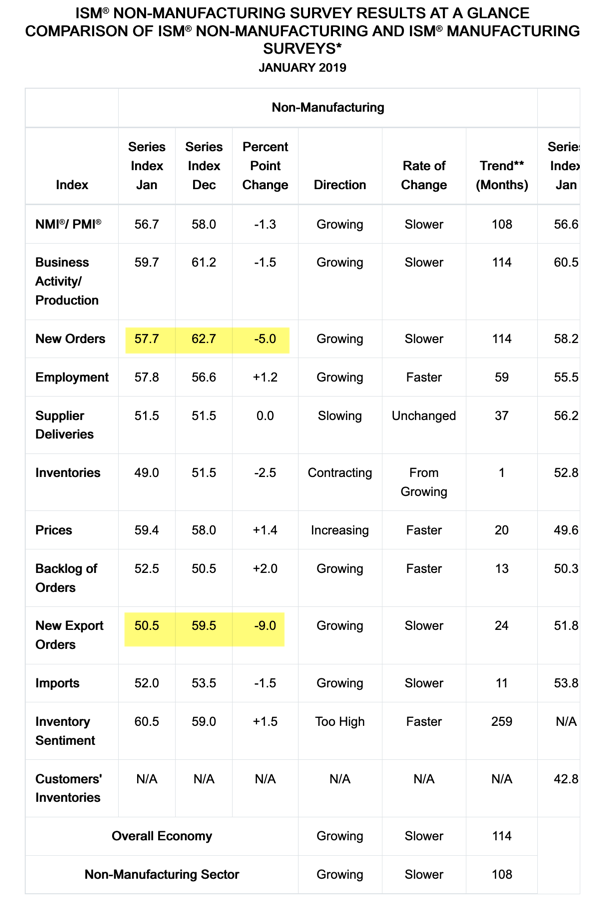
There is also the ISM data, which is a private sector survey. The numbers are still good. For example, the non-manufacturing index is at 56.7%, where 50.0% is considered bad and 60% really good. But the deceleration in the forward looking components – new orders – has been acute. See the numbers highlighted in yellow.
This survey response encapsulates the risk to trend growth:
“Business has slowed well below expectations as our customers deal with the effects of economic situations exacerbated by the government shutdown.” (Construction)
Also see here:
- “We are trying to hold out through the government shutdown. Currently, our work is continuing with already obligated prior-year funds. We have not had to suspend any activities. The shutdown is affecting the United States Agency for International Development’s [USAID] and the Department of State’s ability to process actions, share information or plan for the future. That is the shutdown’s effect on us. The longer it lasts, the greater the disruption.” (Professional, Scientific & Technical Services)
- “Apprehension regarding overall economic conditions due to uncertainly of the partial government shutdown, its effect on business climate and lack of national strategic direction. Economic activity remains strong locally; however, there is concern that this may change quickly due to uncertainty and reports of slowing economic indicators.” (Public Administration)
My view
My read here, then, is that we should expect GDP growth to decelerate rather quickly in Q1 and Q2 of 2019 from Q4 2018.
The rally in stocks and in high yield is technical in nature. For example, stocks of companies that have reported have risen an average of 1.1%. That’s the biggest jump on earnings announcements in a decade. This is papering over the actual declines in trend growth. US Q1 earnings are tipped to decline for the first time in 3 years. A deceleration in GDP growth puts the risk on the downside.
Without more data, it is hard to say where things in the US really are. But some of the last data points are alarming. And I’m not just talking about the ISM. The last factory orders number was for November 2018. That’s Q4 2018 data. And it showed -0.6%, missing expectations by nearly 1%. November durable goods orders also missed expectations by nearly a percent. As Axios recounted this morning, both of these surveys were released on Monday, 2 months behind schedule.
I think the economy weakened considerably during the shutdown and we will see this in the lagged data releases going forward. In the meantime, with rate of change jobs data looking ominous, we should watch tomorrow’s unemployment claims for signs of problems there. As the Labor Department put it a week ago:
In the week ending January 26, the advance figure for seasonally adjusted initial claims was 253,000, an increase of 53,000 from the previous week’s revised level. This is the highest level for initial claims since September 30, 2017 when it was 254,000.
Canary in the coalmine? Just maybe, yes. The Fed is right to pause. We are hitting a rough patch right now. And it’s not clear how long or how deep this will go.
Comments are closed.