Some incomplete comments on the current US economic environment
This is going to be a quick hit post to get some thoughts down on paper because a few threads are coalescing for me that I want to give some coherence to. The essence of the threads revolves around the tension at the Fed between normalizing policy and the ability of the economy to withstand it. My view has been upbeat about the US economy – and that’s been without a trace of recession worry for the last several months. But there are some negative factors coming together that give me pause. And it begins with housing and wages.
On Twitter this morning, I had been in a conversation with Dartmouth Economics Professor Danny Blanchflower and Western Kentucky Economics Professor David Beckworth about whether we are close enough to full employment to begin a full-on assault on Fed policy normalization. Fed Vice Chairman Stanley Fischer seems to think that we are. But the signs that we are not are all around us. And Danny Blanchflower sees wages as a primary sign here. This morning, we three drew the following conclusions from the numbers:
- Blanchflower: Flat and middling wage growth in the US is prima facie evidence that we are not at full employment (tweet here and here)
- Harrison: Inclusion of marginally attached workers and those working part-time unwillingly shows underemployment (tweet here)
- Beckworth: Discrepancy in headline unemployment and U-6 rate is elevated, suggesting underemployment (tweet here)
- Harrison: We are at full employment only if the rise of peak and trough U-6 unemployment over the last three cycles is structural (tweet here)
- Blanchflower: Weekly earnings growth is middling and has actually dropped recently, not indicative of full employment (tweet here and here)
The composite picture we are seeing from wages and underemployment, then, is an economy not at full employment.
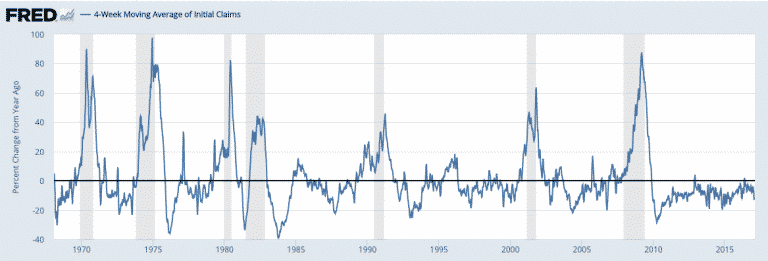
Yet, there are many signs that the US economy is doing well. For example, the Philly Fed Index jumped to 43.3 today, from 23.3. That’s the highest number since January 1984. Another factoid: Initial jobless claims came in today below 240,000 for the fifth week in seven — whereas claims never went below 240,000 once between December 1973 and December 2016. And while you can question how robust that stat is, the fact that jobless claims have been dropping year after year is a sign that distress in the labor market in the US is diminishing. In all prior cycles but one since 1967, you would have seen initial claims rise before recession.
The totality of this picture is one of an economy improving steadily from a picture of extreme levels of distress after a major economic downturn, but one that is not yet at full employment.
So what does the Fed do? According to Stan Fischer, and given comments from Janet Yellen and elsewhere, the right thing to do is to raise rates at a measured pace, gauging how the economy is faring all along the way. If you take the Fed at its word, the Fed understands that its policies act with a lag and are therefore looking to the medium-term impact of their current policies on the economy. And they use this forward-looking medium-term view to decide how quickly to normalize rates.
At the same time, there’s another picture building – a micro view from the housing market that housing data firm Zillow has captured:
At the close of 2016, home buyers purchasing the typical U.S. home could expect monthly mortgage costs of $758 (figure 1),or 15.8 percent of the median household’s monthly income – up from 14.7 percent in Q4 2015 and the highest share necessary since mid-2010. The share of income needed to afford a typical home is still low relative to both the housing bubble years (2000-2007) and more normal times (1985-2000), when the typical household would need to spend 20 to 25 percent of their income on a mortgage, but it’s quickly worsening. And as mortgage interest rates rise and if homes appreciate in value as expected, affordability will deteriorate even more. At 5 percent mortgage interest rates, it will take 17.9 percent of monthly income to afford a monthly mortgage payment on the typical U.S. home; at 6 percent, that rises to 20 percent of monthly income.
But while deteriorating affordability itself is concerning, especially as we look ahead toward even higher rates, the core trend driving it is arguably even more troubling – and it’s happening now: Growth in mortgage payments is currently outpacing growth in household incomes. In 2016, typical U.S. household incomes grew 2.2 percent, a slowdown from growth of 3.3 percent in 2015. The mortgage payment on the average U.S. home, on the other hand, grew by 9.9 percent in Q4 2016, up from 6.7 percent in Q4 2015.

Zillow’s conclusion:
How long this trend can continue is an open debate, but at some point it seems certain that rising mortgage interest rates will begin impacting home value growth as affordability keeps getting worse and more home buyers balk at heftier price tags.
Going back to the Fed then, I am left with the sense that there is a non-zero chance that the Fed misses this factoid and raises rates enough to get us to a point where housing does become unaffordable enough for home buyers to balk. I honestly don’t think this is a problem for the near term, but it is something to keep in mind.
For now, the US economy seems to be doing well and we can reasonably expect the uptrend to continue.
Comments are closed.