New High in U.S. GDP Does NOT Indicate Recovery is Complete
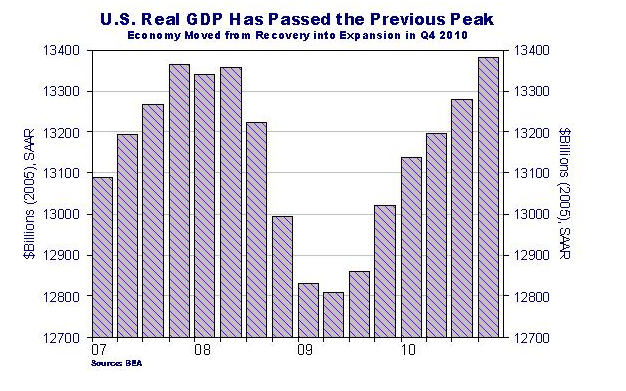
The big news when the advanced estimate of the 4Q/2010 GDP was announced last week was the recovery of the pre-recession level of GDP. This was presented by some as good news, but was suitably qualified by others.
On the surface it might seem someone needs to tell Main Street that their misery must be all in their head.![]() (Before you go off on me, I’m being sarcastic.) Here is the evidence of good news, provided by Business Insider:
(Before you go off on me, I’m being sarcastic.) Here is the evidence of good news, provided by Business Insider:
Actually, this measurement of recession and recovery is flawed. Those who have followed me for a while know I propose that aggregate factors, like GDP, should really be measured against readings normalized to population. After all, to use a ridiculous extreme as an example, a GDP of $1 billion for a population to 100,000 is a much bigger number (10X) in value to society than is the same $1 billion for a population of 1 million. See here.
The following graph shows that, if normalized to population, real GDP is only a little over half way through recovery.
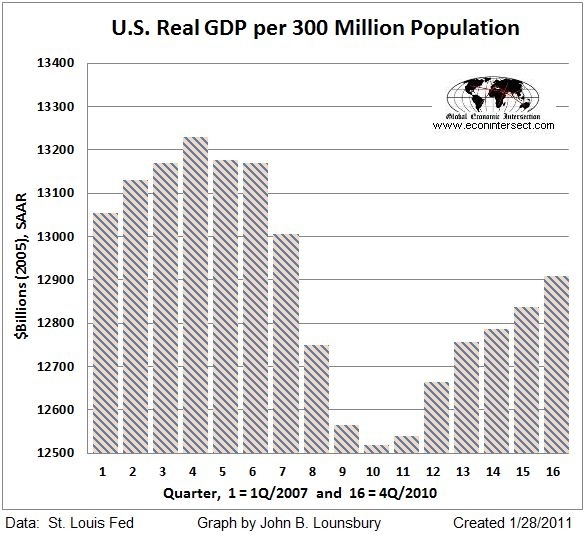
So, not only is the completion of recovery, as indicated by real GDP and the start of expansion indicated by the Business Insider graph, not a good representation of the Main Street economy, it is not even a proper representation of aggregate GDP which should be normalized to the entire population.
The Business Insider graph came from a BTMU (Bank of Tokyo-Mutsubishi) report which also contained the following graph:
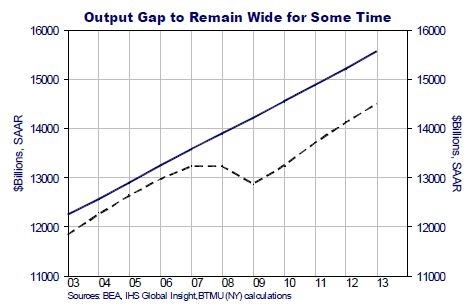
The report discussed the output gap as follows:
…the fact that the U.S. economy has returned to peak (does not) negate the fact that the output gap has grown huge over that time and it will take years of strong, above trend growth to close it. We believe the output gap peaked in 2009, but will still be more than $1 trillion in 2013.
The BTMU report also discusses the record length of time it took real GDP to regain its previous high. The length of time is part of the reason that normalized GDP has so much further to go to complete the recovery. From the report:
The fact that it took a record-long time for the modern day economy to return to its previous peak speaks to the incredible amount of structural, not just cyclical problems in the economy. It seems as though the federal government, and the Federal Reserve for that matter, has learned the hard way that structural problems don’t go away just by feeding it money. Rather, the excessive feeding results in a fat, lazy economy.
Another factor that has received little attention is the inflation of real GDP by a historically low GDP deflator. A graph by Annaly Salvos at Credit Writedowns shows nominal GDP growth:
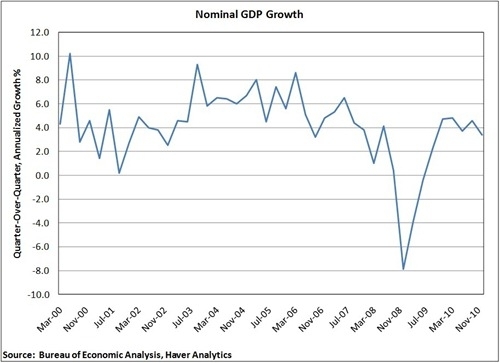
Commentary from Salvos:
Average nominal growth since the late 1940s is about 6.8%, which included the inflationary 1970s and early 1980s, but this doesn’t seem way off. During expansions in the past 30 years, growth has averaged about 6.4%. Current nominal growth is at 3.4% and has been trending down throughout 2010. Considering that we are 6 quarters into an expansion with plenty of unusual stimulus to boot (+$2 trillion Fed balance sheet, +$1 trillion federal deficit), this low level of nominal growth and inflation is surprising.
On several fronts the celebration of the end of recovery and the start of expansion is premature:
- An unusually low GDP deflator is “inflating” real GDP.
- Nominal GDP is growing at half the historic Rates (30-year and 60-year).
- Normalized to population we are only half way to recovering the previous GDP level.
- “Main Street” factors, such as employment and median personal income levels remain depressed.
Normalized GDP – The “Real” Growth by John Lounsbury
I would be curious to know how the various TARP and bailout monies affect the GDP calculations.
Is there a good site that explains how GDP is calculated? I’ve looked at the BEA but it just has terms and isn’t specific with regard to items like TARP (Is TARP a loan? Is it an expenditure? AND is there a differenece between what IT IS, and what IT IS CLAIMED to be?)
As I have mentioned before, the ultra low interest rates may be helping somebody somewhere, but they have diminished my income and consequently my spending.
…and if you account for the massive borrowing by the federal govt. beyond what is a normal, acceptable deficit as a percentage of GDP, you realize that there has been no growth at all! The ostensible growth we’re seeing is all thanks to pulling forward demand fueled by deficit spending – just like the spending during the jolly 2000s was simply demand being pulled forward thanks to equity extraction against an ever-expending estate bubble. We all saw how that party ended!
The only serious game in town right now is the Federal govt. and its prolifigate ways. It’s a kick the can down the road approach that is mathematically certain to end some day. And the longer you play kick the can, the more powerful the smack you’ll get when the bond market finally wakes up and puts a stop to this nonsense (as the politicians will not put a stop to this madness themselves; they are apt to “talk the talk” when it comes to fiscal restraint but are absolutely incapable of “walking the walk”).
In the long run, things will only get better when people understand that the slack in the economy is not the result of normal cyclical forces (e.g. normal inventory cycle type stuff), but instead is a structural problem caused by an overexpansion of credit beyond what is supported by the fundamental growth factors in the economy. One can only mask this true mathematical fact for so long with more stimulus and easing. This will not end well! The math says so.