Around the time that the re-opening rally began to consolidate, I developed a thesis that we would have to wait until September and October before we would know more clearly how the economy would perform over the medium-term. And my view was that this would drive increased volatility in asset markets, potentially leading to a sell-off due to risk off sentiment if the economic outlook was cloudy. This thesis is now playing out. So I want to make a few comments.
Re-examining the start of the re-opening rally
It was back in early June that I began to talk about September and October as a pivotal moment, with the first mention on Credit Writedowns of that timeframe on June 12th. This feels like a phase shift, I wrote at that time.
What we had seen from the March lows was a sharp rise in shares through April 17. That was followed by a consolidation phase through May 13, and a re-acceleration up until June 8th. At that point, I started writing about the potential that we were in a retail investor-led mania. See my newsletters from June 9 and June 10 and June 11
So, when I wrote the June 12 post about this feeling like a phase shift, what I expected to see was another consolidation phase until the Fall. Hence my comments in that post about “fading this market re-opening rally”. I felt that shares had become overextended. And so, the market would trade sideways to down as it looked for clearer signals of an enduring and robust recovery to move higher.
I was wrong. The consolidation ended on June 26. And then it was off to the races. So, yes, it was a phase shift, but toward acceleration, not consolidation.
I spoke to turning point analyst Milton Berg about this in July and August. You can watch the video on Real Vision here. And he agreed that this June 8-11 time frame was meaningful. The data were telling him, “BUY”. But his intuition was telling him, “SELL”.
From my notes, here are some of the turning point signals for market breadth he gave me for that time:
-
S&P 500 5-day ups to down was 3.0 to 1 for first time since 2014. This is a rare occurrence and is a bullish signal with 19% gains in the next several months
- June 8th was 6th time ever that net upside volume as a percentage of total volume was greater than 40%. January 1987 was the last time it happened. And average gains are 25% in the following 12 months. Notable is that, in the past, you never got a draw down of more than 0.8% until now. This time the S&P Small Cap saw a drawdown over 13% and the S&P 500 7%.
-
June 8th was the second consecutive day when upside volume was 9 times downside volume (9 to 1 on 7th and 13 to 1 on 8th). It was also only the 8th time since 1971 it has happened, with median gain of 25% afterwards.
With the benefit of hindsight, I think Milton’s bullish market signals were right. The question is timeframe. In the past, we saw gains over the medium term. Berg looks at median gains over a 12-month timeframe. But, maybe the gains have been compressed into the June to September time frame.
I see two potential outcomes. Either the buy signal gains have been compressed and the volatility today isn’t just a consolidation phase but a fundamental move down or we are consolidating and will be off to the races again in due course.
The fundamentals
I think the fundamentals will tell us which outcome takes hold. If the medium-term outlook for the economy comes into view and shows further robust economic growth. I think we consolidate and move higher. On the other hand, if the economic headwinds cause growth to peter out and roll over, I believe shares will sell off given elevated earnings multiples, especially in tech.
This is what I’ve been saying since June:
As the re-opening now unfolds, the dispersion of outcomes will narrow with either a bullish or bearish skew. And when that narrowing takes form, only then do I think we could see a fundamental move. What has changed now is that the re-opening data prints have gone from prospective outcomes to actual data. And that means, we are in a period of narrowing optionality. Every data print will narrow range of medium-term economic outlooks. And eventually, the bulls or the bears will be forced to capitulate.
[…]
…In my view, we will need a few months’ data before we get clarity on the economy. Moreover, with 45% of S&P500 companies offering no forward guidance, it’s going to be hard to say anything about earnings. Only when the smoke clears from the re-opening, by September and October, are we going to have the kind of clarity we need for shares to move based on fundamentals.
We are much closer to that clarity now – hence the market volatility. But it’s not clear to me which way the data tip. GDPNow for Q3 2020 in the US is showing a 29.6% annualized gain, with the numbers actually having accelerated since the first print on July 30.
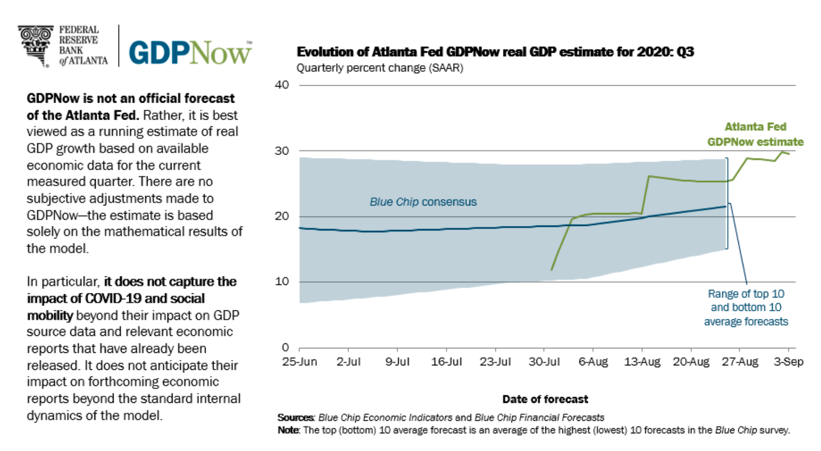
Source: Atlanta Fed
At the same time, we are still seeing 800,000 initial jobless claims per week in the US, a level 35-70% higher than at this point during the 2009 recovery.
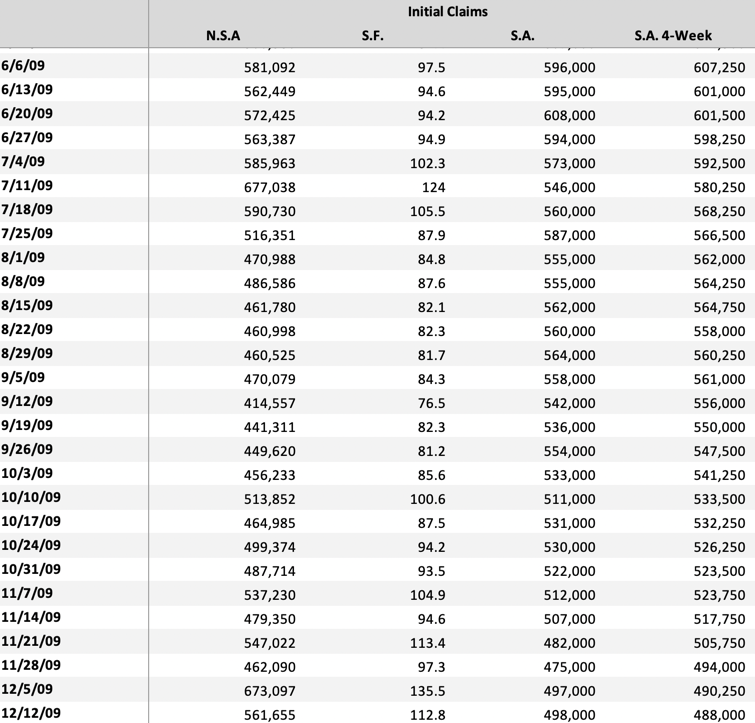
Since economic growth is a flow variable, looking at flows like initial claims is important because eventually they become so large that they overwhelm the economy and turn growth to contraction.
And if you look at the ISM diffusion indices, what you see in the larger services sector is worrying, with the index, production, and new orders all declining.
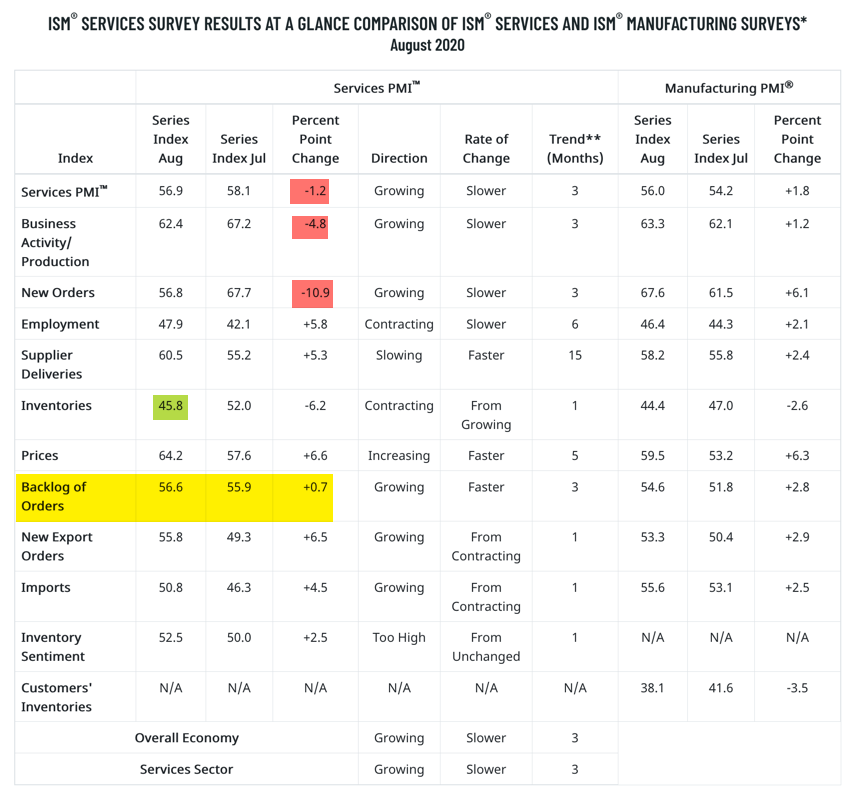
I look the massive uptick in GDP in Q3 as a result of restarting shutdown businesses, pent-up demand and inventory re-stocking. But the massive downtick in New Orders in the services ISM tells you this phase is over. The Fall will be more muted – and in a worst case scenario with no pandemic support, a government shutdown and a large second coronavirus wave, we could even see the diffusion indices go below 50, signalling contraction.
My view
So, as we return to work and school after Labor Day in the US, I see more reason for caution about the economic outlook. And as a result, I think there is also reason to believe the incipient correction in shares could gather steam.
In short, economic risks remain skewed to the downside. But, to the degree economic data prints can continue to meet or exceed expectations, shares can consolidate and continue their rally. Economic risks have been weighted to the downside for months since the re-opening. But, the data have outperformed expectations even so – wildly.
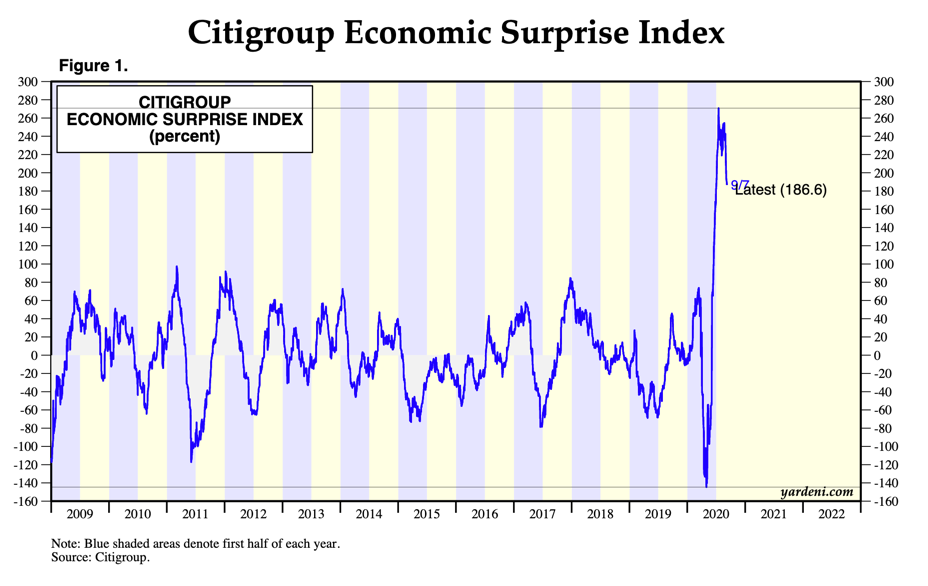
Source: Yardeni.com
How long will this last? That’s the $64,000 question. And the second question goes to whether the rally in equities can survive the inevitable mean reversion in data print surprises. I continue to see this month and next as the crucial timeframe for when this will play out.
Comments are closed.