Recent jobs data supports muted W-shaped recovery for now
The jobs report that came out today and the jobless claims report that came out yesterday both support my baseline view that the rollover in US GDP growth has been mild so far. The threat to that outlook comes in the form of policy and the anticipated business bankruptcy wave that will hit after the summer. Brief analysis below
Baseline outlook
As I put it in late July, “the question is not whether the data rolls over. It’s about how much it rolls over. As I wrote yesterday, I think the second leg down in the W will be limited – with policy errors potentially upsetting that outcome.”
Reuters was out today, showing real-time data confirming the rollover thesis:
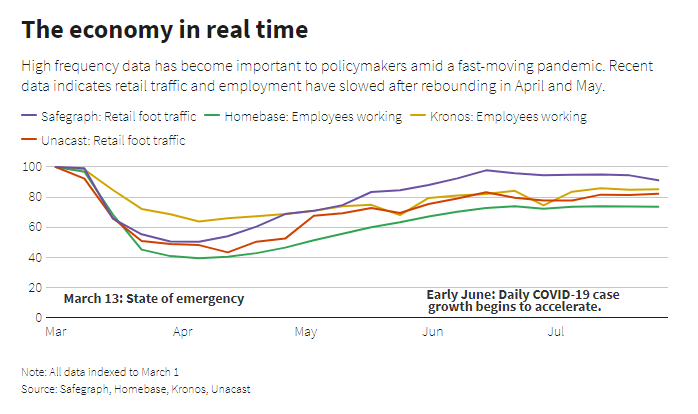
U.S. retail foot traffic is slackening and growth in the number of shifts worked by hourly employees has ground to a halt, a clutch of high-frequency data showed this week, offering the latest evidence the economic recovery that appeared so promising two months ago is rapidly losing momentum.
Weekly data that Reuters follows from sources ranging from the New York Federal Reserve to mobility tracking and small business payroll service providers shows that after big upticks in May and June, activity growth stalled in July as COVID-19 spread rapidly in key areas of the country across the South and Southwest. That recent flat-lining trend has persisted as August began.
This is the chart they used to highlight how real-time data are trending.
I would frame the situation as one in which the lockdown created a massive hole in the economy that was partially corrected by the re-opening. The downtick was straight down, with a -32.9% annualized decline in Q2 GDP. And the uptick has been straight up, with GDPNow trending at 20.3% annualized GDP growth for Q3.
But, a lot of the Q2 uptick was pent-up demand. Moreover, the re-opening brought a large second coronavirus wave with it. And so, the natural rolling over of growth in Q3 from an end to the pent-up demand story is accelerated. I believe Q3 growth nowcasts will decline considerably from the 20% levels today.
The fiscal cliff will now add to that rolling over of growth as the summer ends. And I anticipate another spate of bankruptcies in Q3 and Q4 will add further. Overall then, this is a W-shaped recovery, with the second leg down in growth still dependent on a number of variables going forward.
That’s the macro backdrop for the jobs figures that came out today.
The jobs numbers
According to the numbers released this morning by the US Department of Labor, the rate of growth in employment was high, but it slowed considerably from June. The figures cover a mid-June to mid-July timeframe. And so, I would anticipate the numbers to trend down in a month’s time as well.
Here are some of the headline figures:
- US July Non-farm Payrolls: +1.763 million vs +1.480 million expected and +4.791 million previous and +2.699 million in May
- Headline U3 unemployment rate: 10.2% vs 10.6% expected and 11.1% previous
- Comprehensive U6 unemployment rate: 16.5% vs 18.0% prev
- Labor force participation rate: 61.4% vs 61.8% expected and 61.5% previous
These numbers were generally better than expected. But, the labor force participation rate is weak, signifying murkiness underneath the headline statistics. For me, the numbers are in line with the overall economic outlook, which sees a snapback with re-opening, followed by a levelling off a potential stalling in the economy afterward.
The key constraint going forward is the massive number of people thrown out of work who remain unemployed or have dropped out of the labor force. To the degree they have reduced or zero income, it will reduce consumption and reduce GDP growth. In a worst-case scenario, businesses will have overestimated future consumption and be forced to pull back on output, sending GDP backwards.
Jobless claims
Having said all of that, I look at the claims data more than the jobs report to get a better real time analysis. And I am generally encouraged by what I see there.
We have run into a period of heavy shifts in seasonal adjustments, as I warned a few weeks ago. And that has seen the trend in seasonally-adjusted reported data diverge from the trend in raw data, as the seasonal adjustments have magnified non-seasonal pandemic specific unemployment insurance claims.
So, I am looking at the trend in unadjusted initial claims data to get a better since of trends. And there, the trend since early April is down in every week except one, three weeks ago.
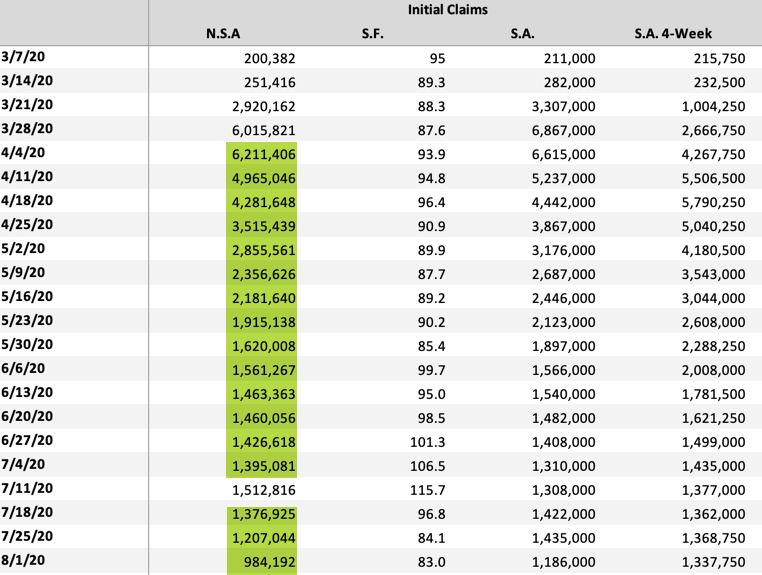
So, we have seen initial claims falling for 4 months now in all weeks except one. I associate the one week with the re-opening rollback. But since the data in the intervening three weeks ahas continued the downtrend, I don’t anticipate the rollback to lead to a major uptick trend in the data going forward.
Notice that the seasonally-adjusted data follow the same trend except during the last two weeks before the previous week. And that’s an artifact of heavy seasonal adjustments, as I told you to anticipate. But overall, except those two weeks, the trend there is also down.
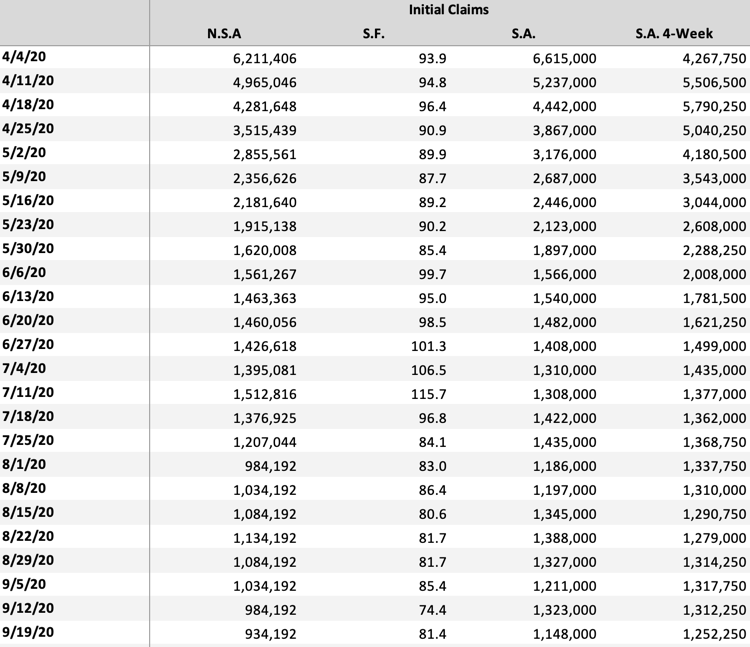
Let’s model a couple of scenarios. Here’s one where claims fall 50,000 a week, less than they have been falling in recent weeks.
That looks good, with the oft-quoted seasonally-adjusted 4-week average falling below 900,000.
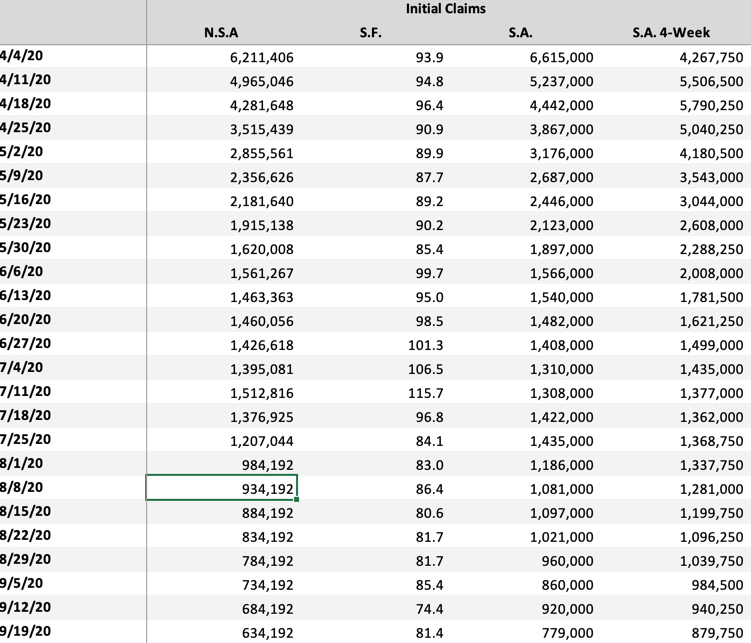
In a scenario in which cases rise by 50,000 per week for three weeks and then fall by 50,000, the data look like this:
Notice that, because of seasonal factors, the seasonally-adjusted 4-week average never rises above today’s level of 1.337 million. We end by almost 100,000 lower.
The bottom line here is that, with the biggest seasonal adjustments behind us, and with raw initial claims data plummeting, for the initial claims trend to look bad, we would have to see the trend reverse markedly in the next several weeks. Put differently, I now see it as unlikely we will see reported claims tick up considerably from here, irrespective of the underlying data.
In short, we were guaranteed to see an uptick three weeks ago and we got it. But, the underlying downtrend was in place underneath the reported data. Now that the heavy adjustments are out of the way, that downtrend will become more apparent.
My take
The biggest risk to all of this is policy. Right now, millions of people are receiving much less in unemployment insurance benefits than they did during the initial phases of the pandemic. That has to ripple through in a negative way into lower consumption growth.
Trump says he plans to fix this via executive order. And he wants to stop evictions too. Let’s see how this pans out. I think the problems are very fixable. But the politics in the US make all worst case economic scenarios viable. Nothing is off the table, including a double dip.
In the meantime, expect the rollover of growth to hit earnings, leading to market volatility in September and October. I think this is about as far as my predictive skills will take me. Have a great weekend.
Comments are closed.