A lot of the data coming out of the US of late reinforces the concept that the V-shaped recovery is flattening out. Meanwhile, in Europe, which has outperformed the US on a currency-adjusted basis, the question now is whether that outperformance lasts. A few broad points on that below
Macro framing
The way I’m thinking about this is as a global economy hit by an exogenous shock in the form of a virus, causing a draconian policy response in the form of widespread economic shutdowns. That was followed by a re-opening, creating a V-shaped economic outcome, where the snapback was less robust than the initial drop-off was severe.
These events are in the rearview mirror, leaving most advanced economies some 7-18% below pre-shutdown levels of output. The question now goes to how rapidly the clawback of pre-shutdown output levels proceeds. And what’s clear from the data is that the initial V-shaped snapback is unsustainable. In fact, we are in the midst of a growth downshift right now. The only question goes to how much the downshift is.
My view is that the lowflation world of secular stagnation that existed pre-Covid still exists now. Except now, there is the overlay of an exogenous economic shock. That increases fragility, particularly where consumers and corporates are indebted like the US and where downward demand shifts are greatest like for small business and travel and leisure. And how much of this is priced in remains to be seen.
That’s my macro framing. At Real Vision, we’re thinking about this in terms of a content campaign in early October where we bring on guests to address the most fundamental questions about the new post-Covid normal. And for me, the questions are two-fold. First, how long does the new normal last, where our behavior has changed because of the fear of infection and death. And second, how much of the eventual longer-term outcome is actually priced in to asset markets.
I am going to write this post with those two big picture questions in mind.
Data
This week we saw that our second look at Q2 2020 US GDP was mercifully better than the first. The second reading on Q2 GDP, saw output down at only an annualized 31.7% rate, vs the 32.9% decline expected.
You laugh? Well, it’s a beat. We were ahead of expectations, right? And for an equity market with huge upside momentum, that matters. Plus Q3 GDP growth is running at a 28.9% annualized rate according to the latest nowcast out of the Atlanta Fed. That’s V-shaped stuff.
By the way, on the maths, 30% down followed by 30% = – 9% down, since 70% multiplied times 1.3 = 91%. So, a 30% lift from a 30% drop is not getting you back to square one. But are we going to get a 30% lift? I am sceptical. Here’s why.
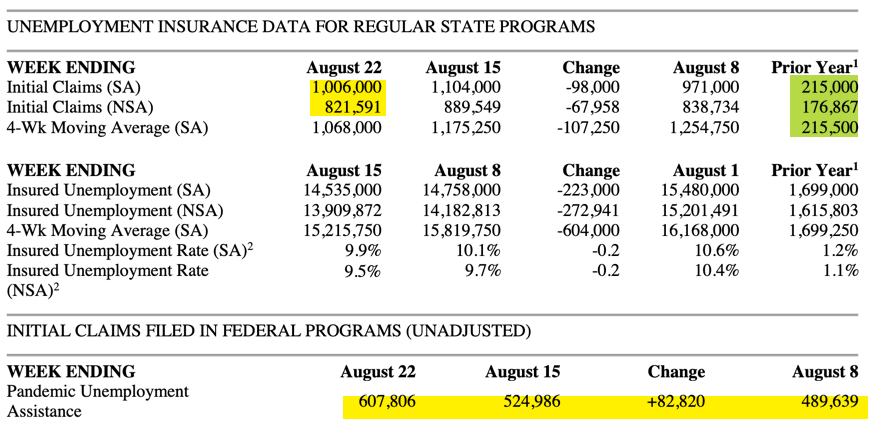
The numbers highlighted in yellow in the data set above are bad. And this is the best real time data we have. What those numbers are telling you is that, although jobless claims are falling, right now 800,000 people are losing their jobs every week in the US. Last year 200,000 people were losing their jobs. So, we are at a level 4 times as high as last year, four months into the re-opening. And this is happening against a backdrop of significantly reduced federal pandemic-related outlays and of extreme state and local government budgetary stress and cuts.
In short, when you have 800,000 people still losing their job every week while those requesting pandemic unemployment assistance is rising — and then you cut transfer payments to the private sector by a massive amount, you should expect bad economic outcomes.
Even if we look in the rearview mirror, to personal consumption data for July, released this morning, you can see the problem.
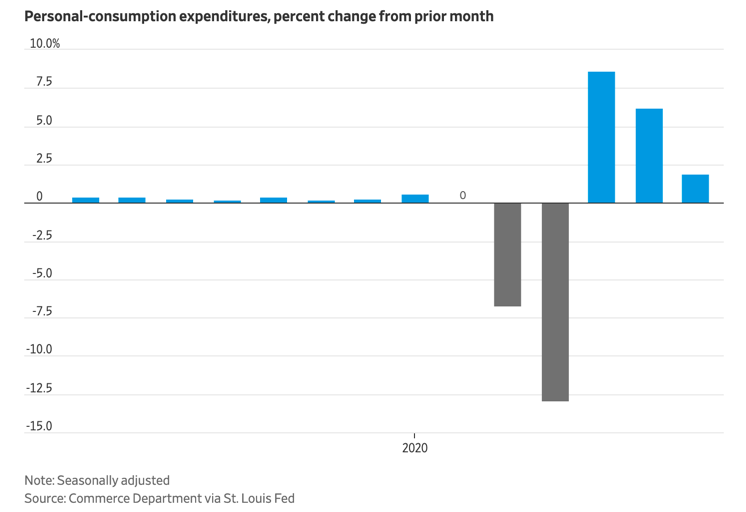
The massive fall in consumption hasn’t been made up yet. And the V-shaped growth is already rolling over. That’s not good – when you have a fiscal cliff staring you in the face. And when the US President’s own negotiating team is telling you nothing is going to happen on that front, even by the end of September, you have to start thinking about downside scenarios.
Downside
That’s why I titled this post “Growth downshift, yes. But how much?”. The question is about how much worse this could get.
For example, if Congress can’t agree on a pandemic relief bill by the end of September, will they be able to pass a short-term spending bill that would fund the government? There’s nothing that should make you believe they would do. And so, if Mark Meadows is pessimistic about a pandemic bill, he’s also telling you you should be pessimistic about a potential government shutdown.
So I see Q3 and Q4 US GDP growth estimates ratcheting down, and earnings estimates along with them.
This morning, I saw that department store Lord & Taylor is going into liquidation. There’s a store less than a mile from me, sitting on perhaps hundreds of millions of dollars worth of real estate. I think Lord & Taylor is a canary in the coalmine. And as the second wave and fiscal cliff consequences come into view in the data, we are going to see a wave of bankruptcies.
That’s going to mean job loss. But many of these will be liquidations that involve massive credit writedowns. That means bank capital losses. Combine that with tightening bank business lending standards and you have a situation with lots of downside risk on the US corporate front.
My take
In a reasonable worst case scenario, the US prints a negative GDP number in Q4. And risk assets reprice accordingly.
The price action in stocks like Tesla speaks to a mania. And US price-earnings multiples speak to vulnerability to downside risk. What would it take for that risk to crystallize when a pandemic and a second wave of viral contagion only sends the markets higher and junk spreads tighter? I don’t know. But I believe the risks are skewed to the downside. And I continue to see September and October as pivotal months regarding those risks crystallizing.
What I want to see is action on the US fiscal front coupled with a slowing in initial jobless claims toward the 400,000 level plus more concrete progress on a vaccine. If we don’t get those outcomes, I think US equity markets are vulnerable.
At the same time, in Europe, a lot of the outperformance has come from currency appreciation rather than local currency index outperformance. The bias toward liquid US markets with their outsized exposure to technology makes sense in a pandemic world. But Europe has done a lot better than the US on the pandemic control front. And so, to the degree US macro risks crystallize, I would expect the European outperformance to continue, this time via outright index beats rather than through the currency. The Euro is stretched at the 1.18 or 1.19 level. And I don’t see a lot of upside from here.
That’s where I am right now. I hope to have more frequent updates for you next week. Happy Friday and have a great weekend.
Comments are closed.