Some soft US data doesn’t yet mean recession
Quick post outside the paywall here on some of the data coming out of the US recently
FedEx bellwether
I wanted to start with FedEx because it is often considered a bellwether of the US economy given its position at the center of shipping and delivery logistics. It released a disappointing earnings report on Tuesday:
FedEx said it now forecasts fiscal 2020 earnings of $9.10 to $10.35 a share, or $10.25 to $11.50 a share excluding expenses and aircraft impairment charges connected with the company’s 2016 acquisition of TNT Express. Neither estimates include year-end mark-to-market retirement plan accounting adjustments.
Analysts had forecast earnings of $12.09 a share, based on FedEx’s previous estimate of $11 to $13 a share.
A lot of this may just be about FedEx’s divorce from Amazon. So I wouldn’t necessarily read the earnings report as indicative of a slowing in commerce.
At the same time, I would note that the Cass Freight Index Report has shown year-over-year declines for every month in 2019 compared to 2018. They say, after the 11th straight monthly decline in their report from October:
With the –5.9% decline in October, following the string of declines in May through September (ranging from -3.0% to -6.0%), we repeat our message from the previous five months: the shipments index has gone from “warning of a potential slowdown” to “signaling an economic contraction.”
[…]
Several key modes, and key segments of modes, are suffering material increases in the rates of decline, signaling the contraction is getting worse.
The chart looks like this:
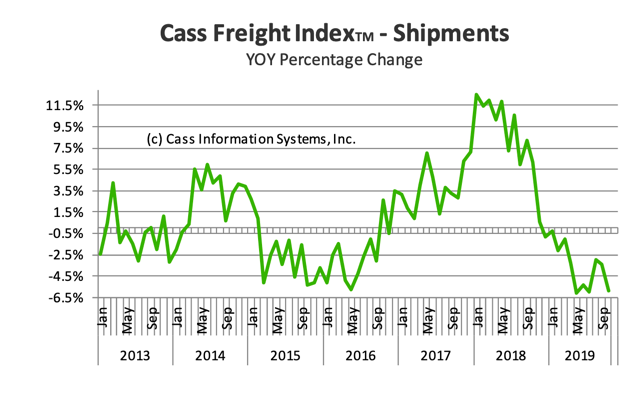
Notice that the declines are of the same magnitude as 2015-2016 now – a little worse in fact. I am not sure what to make of this. But, it is certainly a warning sign that FedEx’s poor numbers confirm.
Jobless claims are elevated
After signalling all clear for a few weeks, jobless claims numbers are showing weakness again. We have seen elevated initial claims for two weeks now, pulling the 4-week average up above year ago levels. So that means that both initial and continuing claims are above year-ago numbers at this point, something I consider a warning sign of continued economic slowing.
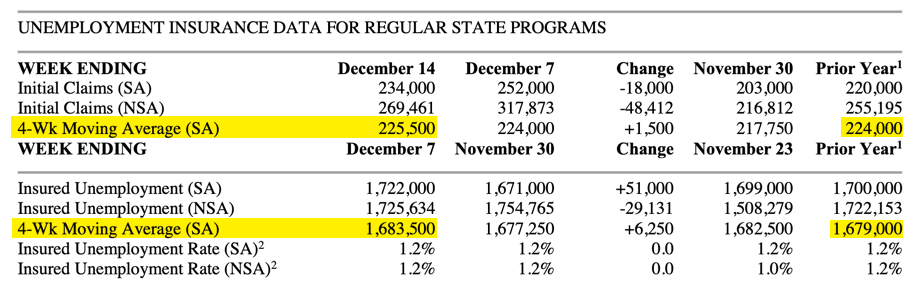
Because initial claims data are a flow metric, a rise in the claims represents a loss of income. And so a persistent rise over a longer period of time should negatively impact GDP growth. The figure I look for to confirm recession is +50,000 on a y-o-y basis or over 6-months. For continuing claims, the figure I have normally used to signal recession is +200,000. We are nowhere close to these levels.
So, I see claims data showing slowing, not recession.
Treasury spread re-steepening
A lot of people have noticed that the Treasury spreads between 2- and 10-year maturities are re-steepening. Here’s a chart Brian Chappatta put up on Twitter yesterday.

DON’T FREAK OUT but 2s10s yield curve is on the verge of steepening past the high-water mark that has lasted all year. pic.twitter.com/Mlx6dpb0KB
— Brian Chappatta (@BChappatta) December 18, 2019
The question is what this means. One interpretation is that it is a bullish signal, showing that we are moving further away from the curve inversion which has traditionally preceded recession. Another interpretation is that it is a precursor to recession because the curve inverts, and then re-steepens before recession.
I think the case is ambiguous because the initial inversion was so short-lived and not particularly deep. Look at the long-term chart:

Source: St. Louis Fed
Notice that the curve inverted briefly in June 1998 but then re-steepened before inverting again in January of 2000. The August inversion looks more like 1998 than it does 2000. But I would be wary of making comparisons either way and judging the curve re-steepening as a signal.
Other data and my view
When you look at last week’s weak retail sales report, you can’t help but think we are seeing middling to weakening growth in the US. A lot of the weakness had been in manufacturing. So analysts are looking to see if the data show bottoming there, while hoping the consumer continues to hold in the meantime.
But that’s not what’s happening. There’s no firm indication that manufacturing is bottoming. For example, the latest Markit manufacturing PMI ticked down a notch from 52.6 in October to 52.5 in November. For now, the services sector is holding though. Markit’s US services PMI printed at 52.2 versus expectations of 52.0. On Real Vision, I spoke to Lakshman Achuthan of ECRI a couple of weeks ago. He is a business cycle analyst. And his data do not show recession. But he told me we are not out of the woods on that front in 2020. (paywalled interview link here).
I also spoke to Danielle DiMartino Booth and Tracy Schuchart about the oil patch and monetary policy because they are releasing a paper on this topic in the next few days. Their thesis is that the oil sector could add some downside risk to manufacturing in 2020, particularly if oil prices decline. A wall of maturities to roll are coming due and the appetite for extending credit has declined.
Moreover, Danielle told me that the CCC universe of bonds is also showing signs of a decline in risk appetite. And she noted that this is not oil-sector specific.; it is a generalized gapping up of spreads.
So my view here is that none of the data are consistent with a recession or an imminent recession. Indeed the Atlanta Fed’s Q4 GDPNow tracker has moved above 2%.
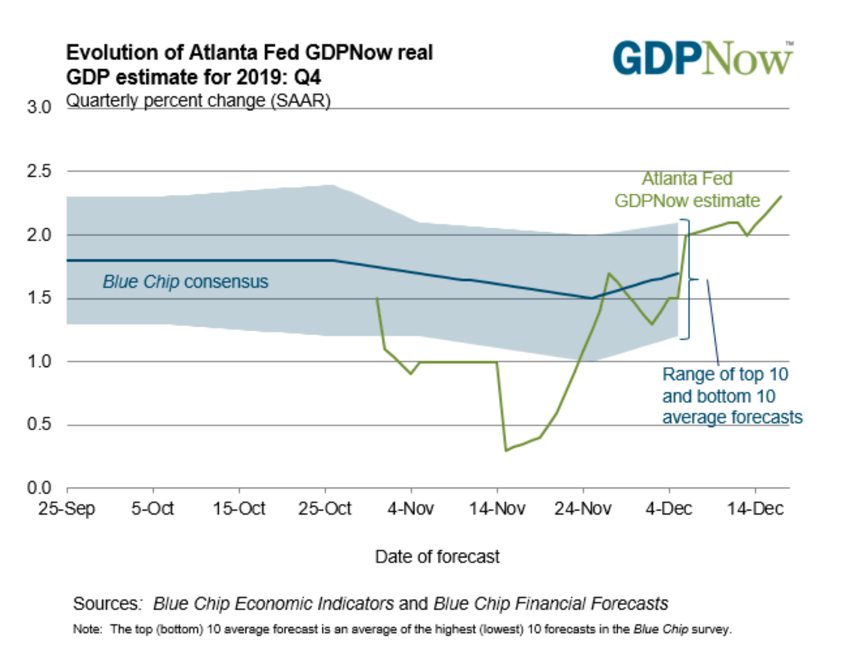
But the data still point to middling growth at best. And there are even some data points that suggest slowing. That’s not great. But it’s not terrible either.
Comments are closed.