What the Fed needs to do this week to assuage the bond market
This is a follow-on to yesterday’s post, where I argued that we are in a holding pattern regarding the thesis that global growth deceleration has ended. The equity markets are positioned as if that thesis is true. But the bond markets show greater caution.
The key is that both markets have rallied. They are both doing well at the same time. But this can’t hold for long. Eventually, one will cede ground to the other. And tomorrow, the Fed’s policy statement and press conference will be crucial in determining how much momentum these markets will continue to have.
Detour into commodities and Dr. Copper
Before I get into the Fed though, let me just give you a few more bullish data points backing up the bottoming thesis, starting with Dr. Copper. As you may know:
The term Doctor Copper is market lingo for the base metal that is reputed to have a Ph.D. in economics because of its ability to predict turning points in the global economy.
And this is what the chart of copper looks like over the past year.
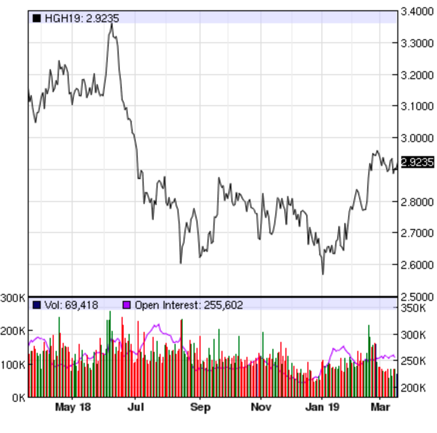
Source: NASDAQ
There was a steep decline in the price of copper, fully consistent with a growth deceleration. And this was happening even as US GDP numbers were increasing in Q2 and Q3 of 2018. But since the New Year, there has been a rally. The level is not nearly as high as it was a year ago. But it is a rally nonetheless. And it is happening from a relatively good intermediate point from within the 5-year chart for the price of copper.
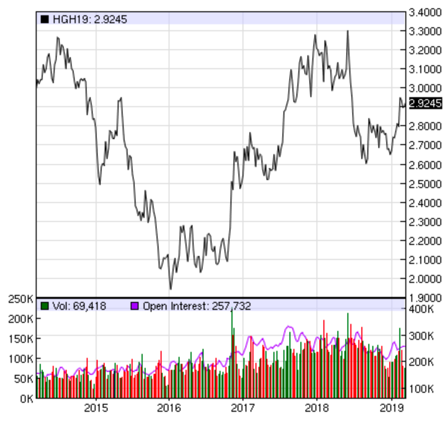
Source: NASDAQ
So, that’s Dr. Copper.
Dot plot
Now, I want to get to the Fed’s balance sheet. But, first let’s talk about the Fed’s rate forecast, the dot plot.
After each FOMC meeting, the Federal Reserve publishes a chart showing 19 Fed officials’ individual projections for overnight policy rates, with a dot representing each Fed official’s expected value of the fed funds rate. This is colloquially known as the dot plot. The reason the Fed produces this chart is both to add transparency to its rate decisions and to influence the bond market’s projections of future policy. It is a key tool of forward guidance.
And outside of rate policy, forward guidance is the Fed’s strongest tool for influencing market expectations, especially on the longer end of the curve. So, the market is going to be keen to see how these dots move in the wake of the Fed’s about face on rate hikes. It will be the most meaningful display of exactly how dovish the Fed has actually become.
In particular, the question is how many rate moves are Fed officials projecting this year. If it’s two moves, the bond markets will throw a tizzy. An average of 1 Fed move may still be hawkish enough to see yields go down. So, the median dot has to show the Fed somewhere between doing nothing this year and raising rates one time — at most. Otherwise, I think we will see yields go lower and the middle of the curve invert even more.
Balance sheet
To me, the balance sheet discussion is secondary. A lot of people are talking about it in terms of supply demand dynamics. Even though, during quantitative easing and tightening, rates have moved in the opposite direction that these dynamics would imply. The reality is that QT is just a signal that amplifies the Fed’s forward guidance. So, to the degree it is rolling off its balance sheet, it implies the Fed has a relatively hawkish bias.
I am looking for the Fed to indicate that it will be doing less quantitative tightening, or even putting the balance sheet reduction exercise on hold. If the Fed doesn’t, it would signal – especially in conjunction with a hawkish dot plot – that its about face on rate policy has been over-interpreted by the market, and that it still wants to raise rates as soon as the data give it the chance to do so. This would mean the Fed still has a tightening bias. And I would expect the market to sell off as a result.
Let’s see what we get tomorrow.
Comments are closed.