How to interpret rising claims and the horrible retail sales figures
The Federal Reserve’s about-face on rates between December and January looks a lot more rational in the context of the US economic data released today. We saw US retail sales unexpectedly fall in December, posting the worst drop in nine years. It was the biggest miss versus consensus since March 2009 too. These figures were delayed a month by the government shutdown. And so, the huge miss tells us we are behind the curve in understanding the state of the US economy.
At the same time, elevated initial jobless claims numbers were released. And I have been telling you that these numbers have been rising of late. It is a red flag for me. So, this latest data point is worrying.
Retail sales
Late in 2018, I was telling you I expected good numbers from the holiday sales season. And all of the data we had received until today confirmed that view. The way I put it in December was that the December retail data would come out in January, showing the economy humming along and make it difficult for the Fed to pause. But those data never came out because of the shutdown. And now that they have come out, they are awful. So we need to reassess.
The first possibility here is that they are not as bad as they look, meaning they will get revised up. Pantheon Macroeconomics mentions this in comparing retail sales to private sector data on retail sales we have already seen.
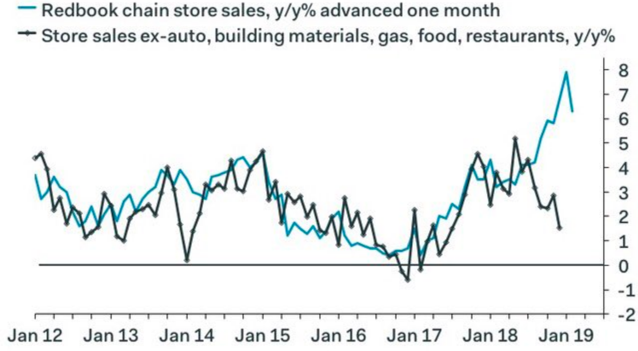
Source: Pantheon Macroeconomics
We can see that Redbook chain store sales have tracked the retail sales numbers pretty well until recently. But that relationship seems to have broken down in 2018.
Moreover, nothing we heard in quarterly earnings calls hinted at the magnitude of this miss. All seemed well until the number came out. And notice that while department stores were down 3.3%, which isn’t unusual, internet retail was down even more, 3.9%. That’s not credible, frankly.
So, I think something shutdown related is going on, since the government shutdown happened at the end of the month. Or the numbers will be revised up. For now, I am considering this a one-off and waiting to see what January looks like.
However, this episode does point out how destructive government shutdowns can be from two angles. First, to the degree the numbers were soft merely because of the shutdown negatively impacting holiday sales, that’s extremely bad. But, more than that, the delay in the data’s release put us in the dark for an entire month. That’s unacceptable. Let’s hope we avoid another shutdown this weekend.
Jobless claims
On jobless claims, the case I make is that they are good real-time data. The year-on-year change in jobless claims coincides or leads economic cycle turns. And so, to the degree we see initial claims data rising, we should be worried.
The way I look at claims is as a drop in spending power. When you get more people filing claims, you’re getting more economic distress that leads directly to lower consumption growth. And if that jump in claims is high enough, consumption falls and we hit a recession.
In the past, my rule of thumb has been that average initial claims rising by +50,000 for more than a few weeks – over a discrete period of six months or a year – practically guarantees recession. The logic goes that 50,000 more people filing jobless claims week after week compared to six months ago or a year ago is enough to sap the economy of a lot of spending power. And that lost spending power spells recession.
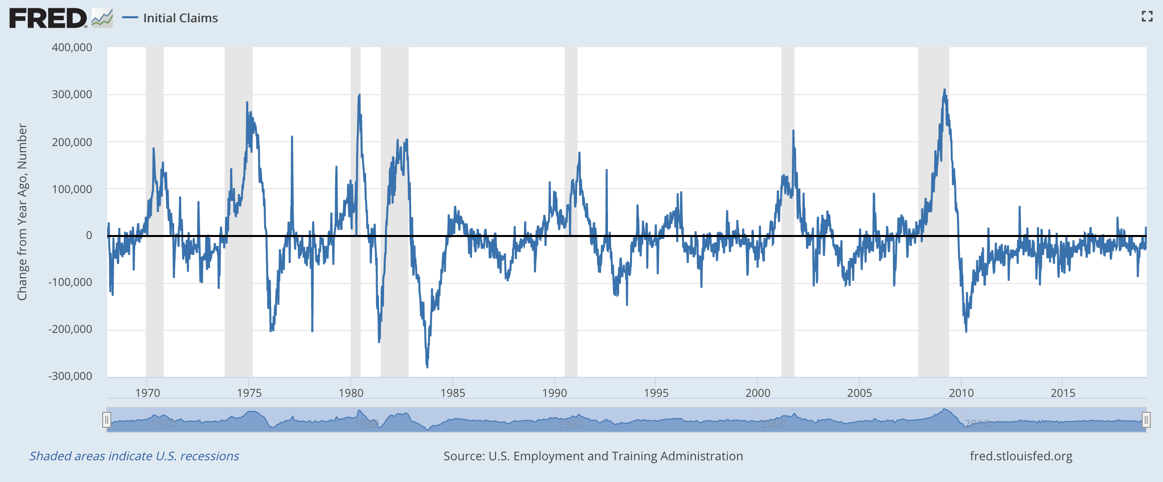
So what are we seeing now? A year ago, the four-week average initial jobless claims figure in seasonally-adjusted terms was 230,000. In the last week, they were 231,750. So, they are higher today than they were a year ago. That’s not good.
Now, again, this could be shutdown-related. But it shows you how destructive shutdowns are, then. And we should avoid then at all costs, because they risk causing a recession.
On the other hand, what we’re seeing could be the beginning of the end of the jobs miracle. Initial claims have been falling steadily over the entirety of this cycle. Notice how consistent the line above is in the -20,000 to -50,000 claims range. Could we be moving out of that range into the rising claims territory? My preliminary answer is yes. And for me, that’s a flashing red signal that means we are entering stall speed economically.
My take
So, my view here is that the Fed will be on hold for at least the first half of the year. Rate cuts are done for now. Even if we see some re-acceleration in the economy, I now find it hard to believe the Fed will even meet its downgraded guidance for two rate hikes in 2019. Moreover, the retail sales figures make the Fed’s move from relatively hawkish in December to relatively dovish in January look like the right one.
Right now, 2019 is looking a lot like 2016, with the Fed reversing course rather abruptly. The big difference, of course, is that we are three years later in the economic cycle. And that makes the probability that this is just a mid-cycle pause lower than it was three years ago.
Comments are closed.