U.S. house price affordability is very sensitive to interest rates
By Sober Look
We’ve had a great deal of movement in the NAR US Housing Affordability Index recently. The index is meant to measure homebuyers’ ability to finance house purchases (discussed here back in 2011) and given some recent events, it’s worth taking a look at what the index is telling now.
First of all, there has been a great deal of criticism of this index (for example here). The index clearly doesn’t take into account factors such as credit conditions, while making some (over)simplifying assumptions (see description). It is certainly a blunt tool that uses the median house price, median household income and the latest mortgage rates. But its simplicity makes it relatively easy to get a picture of “affordability” over time (the absolute level of the index is not very meaningful – just the relative moves). More importantly it’s quite easy to stress-test.
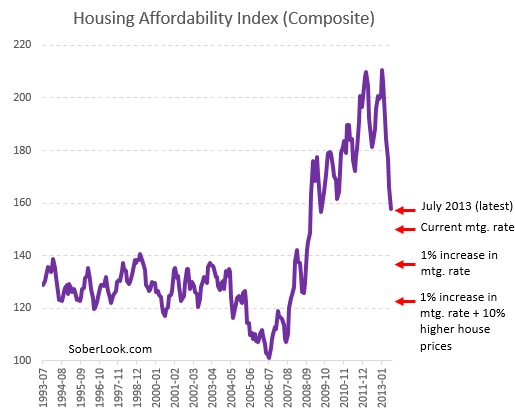
The Affordability index had peaked in early 2012 and has been declining rather sharply since, as home prices began to recover. Along the way however the declines were offset by falling mortgage rates – until recently.
The latest value available from NAR is as of July of this year, when the average mortgage rate used in the calculation was 4.13%. Things have changed since then (see chart). Based on the analysis performed by Deutsche Bank, the chart below shows where the index would be if:
1. we use current mortgage rates (rather than from July) and house prices remain unchanged;
2. 1% increase in mortgage rates and house prices remain unchanged;
3. 1% increase in mortgage rates and house prices increase another 10%.
 |
| Source: DB |
Scenario #3 shows how sensitive affordability is to these adjustments. It takes use below the pre-recession affordability average – a shock that would be quite difficult to for the current economy to absorb. Some would say this scenario is unrealistic. Perhaps. But mortgage rates are up some 1.5% from the lows in just a few months and house prices (based on the S&P Case-Shiller Index) are up 12% from a year ago. Was such a scenario realistic last year?
The conclusion we can draw from this exercise is that with household income growth remaining weak (see post), there is a natural cap on this combination of rates and house prices. Another 1% jump in rates and a 10% increase in home prices and a significant portion of the US population gets priced out of the housing market, forcing prices to stall or even correct.
Comments are closed.