Consumers Come to Terms with Frugality
 by Rick Davis, guest author, founder and CEO of the Consumer Metrics Institute.
Our Daily Growth Index at the Consumer Metrics Institute has continued its descent into record depths of contraction, reaching the year-over-year level of decreasing consumer demand of -6.68% on May 12, 2011.
There are several key aspects of that decline that lurk beneath the raw contraction rate:
– The numbers are year-over-year against already contracting consumer demand last year. At mid-May 2010 our measurements of consumer demand for discretionary durable goods were already showing a -1.8% slowdown compared to May 2009 — meaning that the compounded two year movement is well in excess of -8.5%.
– The new record low of -6.68% should be viewed in the context of previous records: the lowest level reached during the “Great Recession” was the then record -6.02% set on August 29, 2008; while the most recent new record “bottom” was -6.13% set on October 4, 2010. The new record exceeds the 2008 low by 10%, and the 2010 “bottom” by over 8%:
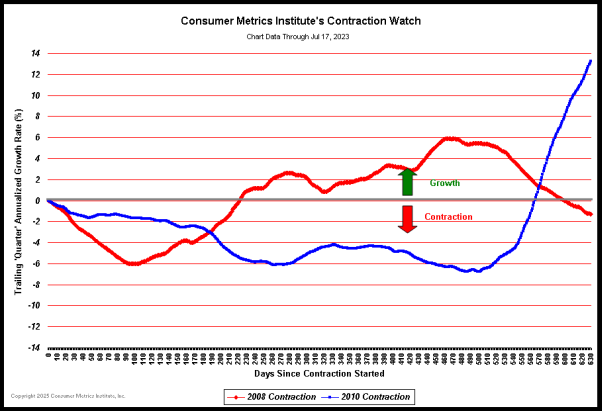
– Because our ‘Daily Growth Index’ is essentially a moving average of a trailing 91-day ‘quarter’ in our ‘Weighted Composite Index’, it can be tilted lower by either sharp downward blips in the ‘Weighted Composite Index’ or more prolonged weaknesses. For the record, the new ‘Daily Growth Index’ lows are not being caused by extraordinarily low daily ‘Weighted Composite Index’ numbers (which were actually lower in mid-March 2011), but rather by unrelenting day-after-day ‘Weighted Composite Index’ values in the 92 to 94 range.
– This in not a short term effect similar to the 7-month consumer belt tightening that we saw from the summer 2008 through early 2009. The current persistence suggests that consumers have come to terms with the need for a longer term frugality — perhaps not wishing to repeat the premature “green shoots” optimism of early 2009.
– To our eyes the above chart shows no visible signs of imminent recovery.
We also publish a chart plotting the daily progress of our ‘Daily Growth Index’ over the past 60 days:
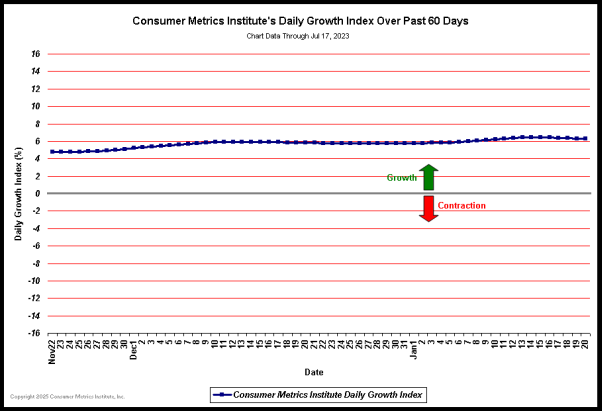
During the “Great Recession” we were concerned when we had to change the scale of the above graph several times to keep the line from dropping out of view — doing it for the “last” time in late August, 2008. We fear that a deja vu moment may happen sooner than we might have hoped.
Related Articles
Contraction Watch: Discretionary Expenditures Declining by Rick Davis
Inflation: Short- and Long-term View by Doug Short, Steven Hansen and John Lounsbury
Wholesale Sales: Evidence of Moderate Growth by Steven Hansen
A Significant Reason Retail Sales do not Indicate Recovery by Doug Short
Strong Retail Sales Do Not Point to Real Economic Growth by Steven Hansen
U.S. Problems are Institutional by John Lounsbury
Underneath the Happy Talk, Is This As Bad as the Great Depression? by Washington’s Blog
Comments are closed.