Fewer Foreclosures but Worries Increase
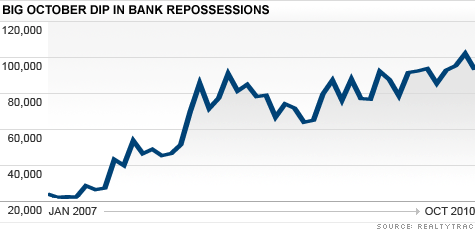
 It sounds contradictory, but the headline is correct. According to Realty Trac, foreclosure actions declined 4.4% in October and are likely to fall further in the next month (or even longer). The final stage of the process, repossession, saw a decrease of 8.7% MoM. These declines have been attributed to effects of foreclosure freezes resulting from the mortgage mess from faulty documentation producing ownership questions.
 These legal problems may have an impact on overall foreclosure filings, but the variation from September to October in repossessions looks very much like a typical fluctuation, as shown in the following graph from CNN Money:
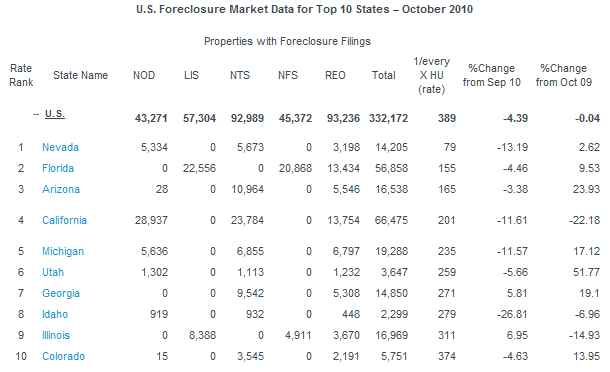
 The possible impact of the foreclosure documentation mess on the top ten foreclosure states is evident in the following table from Realty Trac. Four of the states (Nevada, California, Michigan and Idaho) have had much larger declines in foreclosure activity than the remaining top six.
To explain the terms in the table Realty Trac provides the following:
Report methodology
The RealtyTrac U.S. Foreclosure Market Report provides a count of the total number of properties with at least one foreclosure filing entered into the RealtyTrac database during the month — broken out by type of filing. Some foreclosure filings entered into the database during the month may have been recorded in previous months. Data is collected from more than 2,200 counties nationwide, and those counties account for more than 90 percent of the U.S. population. RealtyTrac’s report incorporates documents filed in all three phases of foreclosure: Default — Notice of Default (NOD) and Lis Pendens (LIS); Auction — Notice of Trustee Sale and Notice of Foreclosure Sale (NTS and NFS); and Real Estate Owned, or REO properties (that have been foreclosed on and repurchased by a bank). The report does not count a property again if it receives the same type of foreclosure filing multiple times within the estimated foreclosure timeframe for the state where the property is located.
The foreclosure outlook is worsening because, as home prices fall, more mortgages go into negative equity and those already under water go deeper into the red. Continuing high unemployment negatively effects foreclosure rates. Unemployment remains at stubbornly high levels; the number of employed remains below 140 million (139.1 million in October) and 9.1 million were employed part time for economic reasons (involuntary part time). When you subtract 18.2 million who are working part time by choice, the current number of people employed full time is 111.8 million. That is down nearly 10 million from 121.7 peak in November 2007. That represents a potential decline in demand for housing up to 3 million units from 2007, estimated using the average household size of 2.62 persons and assuming at least 25% of the full time jobs loss did not result in loss of ability to maintain independent household units.
Finally, the current home ownership rate is 66.9%, so up to 2 million home ownerships are exposed to default because of unemployment and under employment alone. Michael David White reports that more than 11 million homes will default in this cycle, so the employment data does not explain approximately 80% (9/11) of the potential foreclosures.
A close correlation for the 11.57 million number is the number of mortgages underwater. Out of a total approximately 51 million mortgages, 21.5% had negative equity in the second quarter. This totals 11 million, very close to the White number of eventual foreclosures. With home prices likely headed lower it remains to be seen if the 11.57 million foreclosure estimate may be too conservative. While unemployment may be producing some of the foreclosures, the largest effect can be attributed to the loss of home market values. And those losses may not be over.
Related Articles
The Mortgage Mess by Yves Smith
Unemployment and Foreclosures by John Lounsbury
Housing Price Decline Continues by Steven Hansen


Comments are closed.