Political impasse over jobless claims just as they mushroom
Framing the economic path
This is just a quick update on how I am thinking about the US economy. I am going to put this outside the paywall for once in order to update everyone. I’ll put the run-up to today in a bullet point framework up front.
- Despite a very brief yield curve inversion last year, the US economy was re-accelerating as the new year began.
- But the global economy was hit hard by coronavirus beginning in February, as supply chains suffered due to China’s lockdown. Accordingly, the recession dating committee of the National Bureau of Economic Research dates the US recession from February 2020.
- There was a catastrophic falloff in consumption and output as the US went into lockdown in March. GDP numbers for Q1 were horrible. But the numbers will be even worse for Q2, which began in April.
- Only beginning in May did the US economy begin to slowly emerge from the lockdown recession. And so, even in May, employment, consumption and output numbers looked poor compared to February.
- But by June, with the lockdown over all across the US, the US was in full recovery mode. I believe the NBER recession dating committee will be forced to call the recession’s end in May or June.
- Unfortunately, the US re-opening from lockdown was premature in the sense that community spread of Covid-19 was still occurring at high levels. Testing was inadequate to capture the extent of community spread and social distancing protocols were poor. So, the US saw a mushrooming of Covid-19 cases.
- Even in the DC area, where I live, it was clear that social distancing on the July 4th weekend was poor. And intra-US mobility has increased due to holiday-maker travels. I believe these are two factors that should contribute to rising case counts, not just in the sun belt, but all across the US, including in the DC area.
- The rising case counts have led to health system overload and rising deaths. This has both put a chill on in-person consumption and caused a partial rollback of the re-opening. The result is now apparent in real-time economic data including jobless claims.
That’s where we are now.
The coincident unemployment data
As an aside, let me continue the thoughts I mentioned in yesterday’s subscriber post on the information silo. I watched Fox and Friends again this morning. And throughout the 15 or 20 minutes I saw the program, not once did they mention the mushrooming Covid-19 epidemic. Despite a record case count yesterday over 70,000, it was almost as if the pandemic wasn’t happening.
Before shutting the TV down, I did a quick flip to Morning Joe on MSNBC and they were talking about the pandemic, misgivings about taking the CDC out of the loop on hospital reporting, and the need for increasing testing. It was only then that I actually realized that Fox and Friends hadn’t talked about the pandemic during the entire time I had watched it. I hadn’t actually missed that reporting when I was watching the show. The juxtaposition between the two shows is what clued me in. That shows you how strong these information silos are.
That’s in the back of my mind now as I think about the real time data, because it means a lot of people in the Fox information silo are not going to react negatively to the rise in case counts simply because it’s not information they have to process actively. Many will continue business as usual. And, to a degree, that will keep GDP growth chugging along, even as death counts rise.
As far as coincident data go, it’s the jobs picture that matters most.
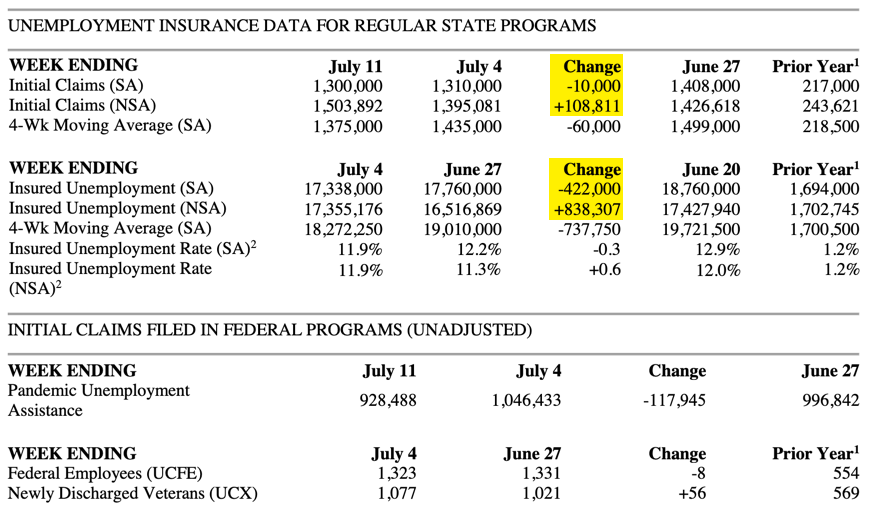
If you look at the data above, reported yesterday, you will notice that initial and continuing jobless claims both rose. And that’s significant for a number of reasons.
First, this was the first rise in initial claims since the lockdown began. Unadjusted initial claims had been down every week until last week. So, last week’s increase marks a turn of huge significance given that claims are still running at unprecedentedly high levels.
Second, the seasonal adjustments were large enough last week that both reported seasonally-adjusted numbers fell. But the delta between the unadjusted numbers and the adjusted ones was massive, with the change differential almost 120,000 on initial claims and over 1.2 million on continuing claims. What this means is that people only reporting and looking at the seasonally-adjusted data will miss the uptick in claims and not realize that the re-opening rollback is already leading to higher unemployment.
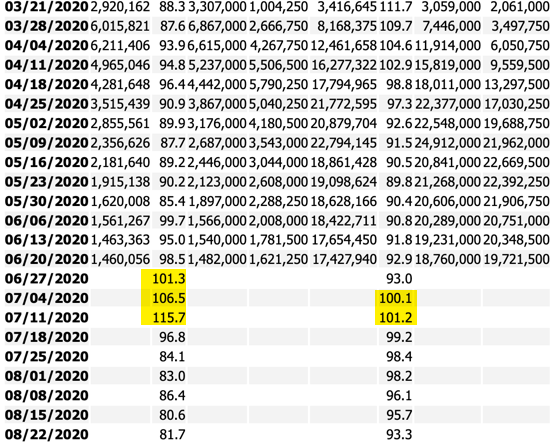
Third, the seasonal adjustments will become much less severe in the next couple of weeks. The recent factors are highlighted in the snapshot below.
Before I explain, let me tell you how the adjustments work and why we have them. Because layoffs occur in a seasonal pattern, there would be stark differences in raw data across any given year even if economic fortunes didn’t change. So, government statisticians create seasonal adjustments to make apples to apples comparisons across the year, making post holiday-season data in January largely comparable to data in April or October, for example. These factors are created in advance. There’s no data massaging here, just people trying to give you the best possible data sets.
The problem is that the pandemic has made unemployment insurance claims so high that even yesterday, 4 months after the lockdown, the initial claims numbers were twice as large as they were at their worst in the Great Recession over a decade ago. So, seasonal factors have a massive – and I believe distortionary – impact.
Next week will see the initial claims factor go from 115.7 this week to 96.8 next week. That’s a massive 19% adjustment in just one week, just as I anticipate claims will be vaulting higher. So, we should expect to see an absolutely massive increase in initial claims next week because of the outsized impact of seasonal adjustments.
Here’s a numerical example. Last week, we saw 1,503,892 initial unemployment insurance claims in the US. Divide by the seasonal adjustment of 115.7, multiply by 100 and round up to the nearest thousand at 1,300,000. (I actually got 1,299,000, not sure why. But this is how it works). So, the reported number was down 10,000 even though the actual number increased by almost 109,000.
If actual initial claims next week go up a paltry 17,000 to 1,520,000, you’ll need to divide by a much lower .968 adjustment factor. And that gets you to 1,570,000 seasonally-adjusted claims, an increase of 270,000. People will glom on to that increase and markets will react accordingly.
And remember that, for claims to not go up next week, they would need to fall from 1.5 million actual claims to 1.258 million next week.
My view
So, next week we are practically guaranteed to see a horrifically bad jobless claims number. This is how the math works. If, as I believe, we are seeing more layoffs, then the actual number could rise to something like 1.7 or 1.8 million claims. 1.7 million divided by a seasonal factor of .968 gets you to 1,756,000 claims. And that would have the media reporting that claims increased by 456,000. So, be prepared to read something of that ilk next week. It may roil markets.
Now, according to Politico:
President Donald Trump has signaled to Hill Republicans that he will not sign a new coronavirus stimulus package without the inclusion of a payroll tax cut, according to three sources close to the issue.
This new red line from the White House serves to illustrate the challenges that lay ahead in negotiating another Covid-19 relief package. GOP and Democratic congressional leaders are trillions of dollars apart in funding goals for the package, as well as how those funds will be spent.
Don’t assume that a new stimulus bill is a done deal or that the PUA program, giving people $600 a week in extra benefits, will continue in its present form.
At the same time, remember that the JPMorgan Chase Institute is reporting the following:
“Although average spending fell for all households as the economy shut down at the start of the pandemic, we find that unemployed households actually increased their spending beyond pre-unemployment levels once they began receiving benefits.”
Three conclusions we can draw from this research:
- If the PUA is not extended, the US will fall back into recession
- Marginal propensity to consume is greater for lower income households
- Fiscal deficits are preventing an economic Depression
On that note, Politico say Evercore ISI has looked at the data and determined that allowing the enhanced unemployment benefits to expire would lead to a 2% smaller GDP by the end of 2020.
Looking at the policy impasse and the data, I think we could be headed for a double dip recession here. And given how precarious the economic situation is for small and medium-sized businesses and overly indebted larger businesses, such a policy error would have disastrously negative consequences.
This would be a completely avoidable recession. But, just as with the spike in coronavirus cases in the US, that doesn’t mean it can’t happen. Hopefully the huge uptick next week will concentrate minds.
Comments are closed.