This comes from the Washington post:
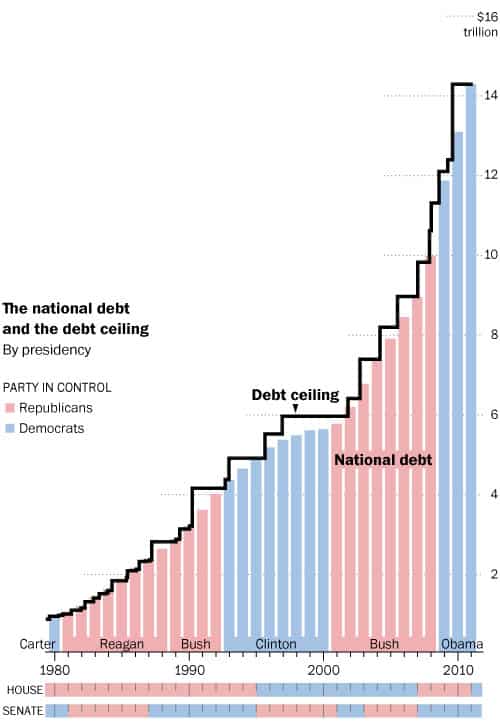
Since 1980, the debt ceiling has been raised 39 times. It was raised 17 times under Ronald Reagan, four times under Bill Clinton and seven times under George W. Bush. Congress is currently in a contentious debate with the White House on whether to raise the ceiling by the Aug. 2 deadline, which would make the fourth raise under Obama.
Source: Who raised the debt ceiling? – Washington Post
We’re now up above $14 trillion (including money held by federal agencies). That’s up from $830 billion the last time a debt ceiling showdown went down to the wire in 1979. In case you were wondering what a trillion dollars looks like, here you go:
Source: What does one TRILLION dollars look like? – PageTutor