Earlier today, Andy Lees of UBS posted the W-bottom chart that Global Macro Monitor caught a few weeks ago. The global Macro guys were posting on August 30th, saying:
We don’t know and not willing to make a huge bet either way. The next negative headline and tape bomb will be the true test.
The negative headlines are here and the tape bomb shows a failure to confirm, which has Andy Lees thinking about where the next stop is.
He writes:
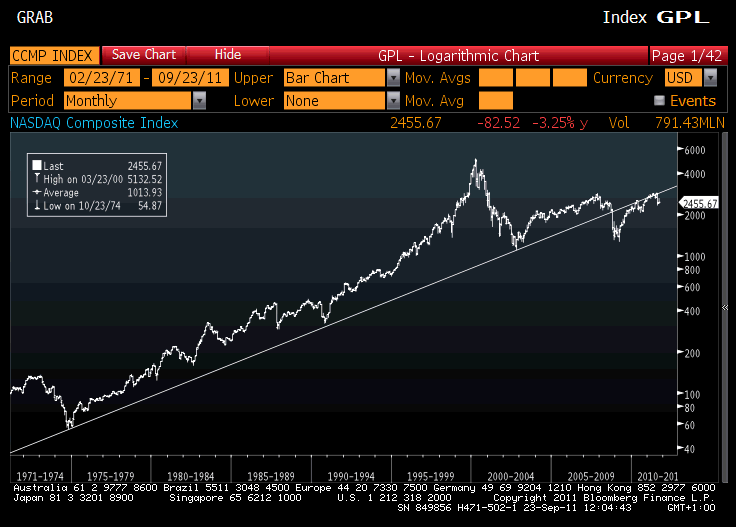
what happens over the next quarter and the quarter after that until we either reach the sustainable level of output with rates here or the Fed bridges the gap with QE4? A simple chart of the S&P suggests the next stop is around 900 – 950 whilst the second long term log chart on the Nasdaq puts the move into perspective.
Also see from last month: Zulauf: "I expect the market to go below the latest lows in September." Zulauf has done a good job on calling the macro picture in this environment. he seems to think that:
Once the S&P 500 falls to 1000 or below in the first half of 2012, the Fed will come in and try to support the system. Eventually the ECB [European Central Bank] will try to do the same thing in Europe. The damage in Europe will be greater, as Europe’s financial system is even weaker than the U.S.
If the CBs do reach into their arsenal for even more liquidity to maintain support, they’ll need to get out the bazooka because the ammo they are using now isn’t giving people any confidence whatsoever.