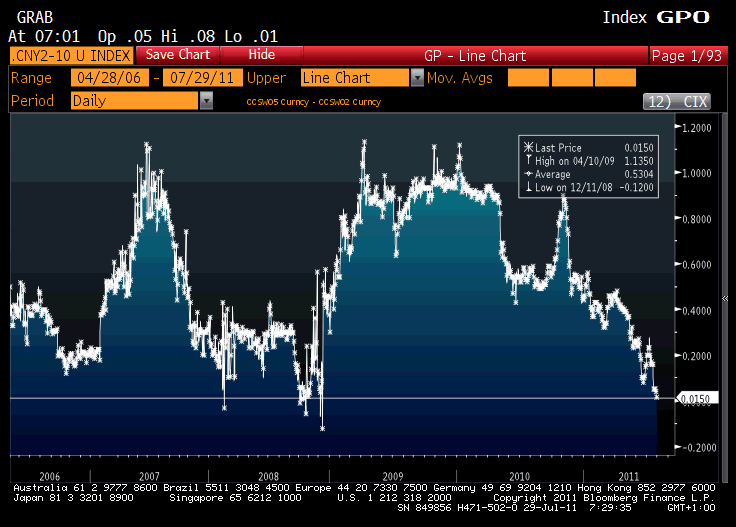
Andy Lees produced this chart via Bloomberg. It shows the Chinese 2-5 year swap spread flattening to 1 basis point. The last time it was this flat was 2008, during the global panic that followed the bankruptcy of Lehman Brothers.
Yield curves are useful predictors of future economic growth as they embed future interest rate expectations. For example, a negative-sloping yield curve for US Treasury bonds preceded six of the seven recessions since 1969 in the United States. This yield curve is telling us that markets anticipate Chinese policy easing in the future, presumably as a reaction to slowing growth.