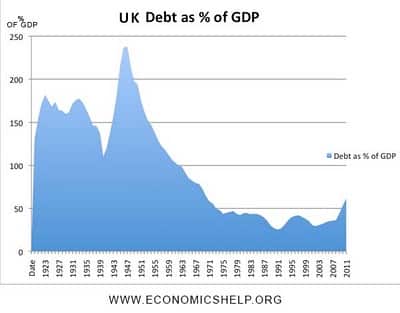
As a result of the two great wars in the 20th century, the UK’s national debt soared such that by the end of World War II, public net debt was well over 200% of GDP. In the period after this, despite the modified gold standard of the Bretton Woods system, the UK was able to work these debt levels down to well under 50% of GDP.
How did the British do it? It was mostly through a combination of currency depreciation and inflation. 100 pounds in 1945 are worth approximately 3200 pounds in today’s money.
Source: Time Series Chart of UK Public Spending, ukpublicspending.co.uk